Whether you’re still planning or in the middle of the project execution maelstrom, Microsoft Project calculates scheduled values, which are the forecast values at the moment you look at them. Once the project is underway, the scheduled values are likely to drift away from the baseline you set. And those variances are the clues that your project needs attention and about what you might have to do to restore it to health. The topic of comparing progress against a baseline is something you’ll want to understand thoroughly in order to pass Microsoft certification exams for Project 2010 (70-178).
Scheduled values take into account actual values you’ve recorded and the forecasts for the work that remains. If you’re still planning, scheduled values are pure forecast. When the project is done, the scheduled values equal the actual values. Variances are the difference between scheduled and baseline values.
One quick caveat: If all the variances are zero, chances are you haven’t set a baseline yet. You can’t have a variance between scheduled and baseline values if there’s no baseline.
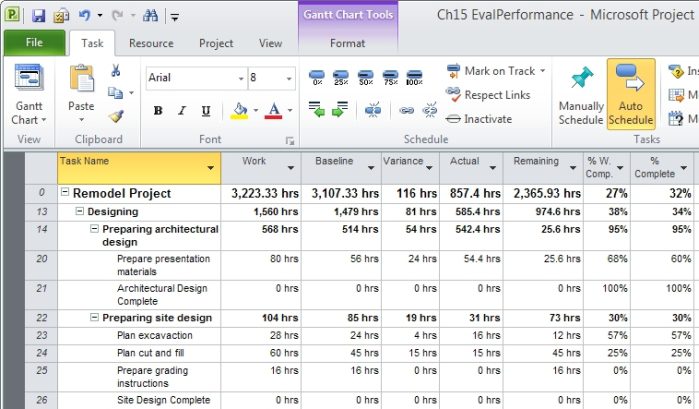
Looking at variances at the project level is a first step for sniffing out problems. You can see project-wide measures by looking at the Project Summary Task in a Gantt chart view. To see different variances in the project summary task row, apply the Variance, Work, or Cost tables to the view. (The screenshot shows the project summary task with the Work table.) You can also see variances in the Project Statistics dialog box (on the Project tab, click Project Information and in the Project Information dialog box, click Project Statistics) or by running the Project Summary text report.

When Start, Finish, Duration, and Work variances are greater than zero, the project may be behind schedule. Work and Cost variances greater than zero could mean the project is over budget.
Another way to scope out potential problems is by comparing the percent complete for Duration (% Complete) and Work (% Work Complete). If duration has a higher percent complete than work, the project has more work remaining than the duration to perform it in. (However, contouring tasks so more work occurs later on has the same effect.
Finding delayed tasks can help you correct course before things get completely out of hand. Project has several filters and reports for looking for delays — even ones that haven’t occurred yet.
The Should Start By filter and the Should Have Started Tasks report list tasks that should have started by the date you specify — such as your most recent status date — but haven’t. They look for tasks whose Start values are earlier than the task should-start-by date as well as those that don’t have any Actual Start values.
You can also look for tasks whose finish dates are late or whose work hours are greater than the baseline work. Slipping tasks have finish dates that are later than their baseline finish dates. The Slipping Tasks filter and the Slipping Tasks report both show slipping tasks.
The Slipped/Late Progress filter shows slipping tasks and tasks whose actual work is less than the amount that should be done. The finish date may not have changed, but it could if you don’t take action.
If work takes more time than you estimated, task durations and costs can increase. The Work Overbudget filter shows tasks whose actual work is greater than the baseline work, so the tasks are already in trouble. You can’t do anything about completed tasks, but you should investigate why the work hours increased. If the issue is lower productivity, you might have to replace resources or eliminate obstacles for your team members.
Similar to overbudget work, you can use Project tables (Cost), filters (Cost Overbudget), and reports (Cost Overbudget) to look for overbudget costs.
Earned value analysis puts project progress into dollars and measures how much of the project cost you’ve earned so far through completed work. You have to set up a few things in Project before you can use earned value analysis.
- Set a baseline so you have baseline values to compare to.
- Enter actual values for the work that has been completed.
- Set a status date (Choose Project | Properties | Project Information. In the Project Information dialog box, choose the date in the Status Date box.
- Set the options for how Project calculates earned value. You can specify the baseline Project uses. You can also tell Project to use % Complete to calculate variance or Physical % Complete. In the Project Options dialog box, go to Advanced and look for the “Calculation options for this project” label.
If you use the Physical % Complete field to calculate earned value, you have to enter values for your tasks. For example, you can set Physical % Complete to 0%, 50%, or 100% depending on whether tasks are unstarted, in progress, or complete. Or, you can copy the value from the % Work Complete field into Physical % Complete.
Three measures represent the pillars of earned value analysis:
- Planned cost for scheduled work is also known as the budgeted cost of work scheduled (or BCWS, which is the name of the corresponding Project field). This is the cost you estimated for the work scheduled through the status date — in other words, the baseline cost for the work that should be completed as of the status date.
- Planned cost for completed work is called earned value, because it’s the baseline cost the project has earned with completed work as of the status date. The other name is budgeted cost of work performed or BCWP.
- Actual cost of completed work is how much you actually spent as of the status date.
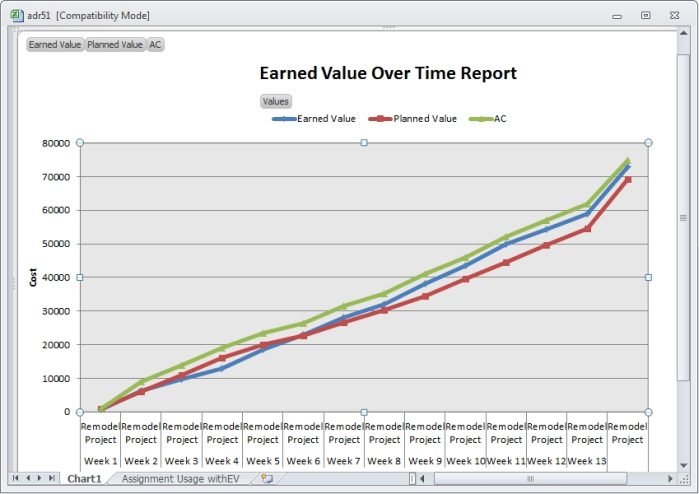
Because planned value, earned value, and actual cost are all measured as money, you can compare them to check schedule and cost performance. The Earned Value Over Time visual report, found in Project 2010, shown in the screenshot, presents all three measures over time.

- If earned value is less than planned value, less work is actually completed than you estimated, so the project is behind schedule.
- If the earned value is greater than the actual cost, the work you’ve completed cost less than you estimated so the project is under budget.
Additional Earned Value Measures
One tricky bit in Project is getting Cost Variance and CV fields straight. For example, if the Cost Variance field shows a variance of $1,000, then the CV field shows a variance of ($1,000) or -$1,000. The CV field is earned value minus actual cost; so when CV is a positive value, the project or task is under budget, a desirable (or positive) result. The Cost Variance field is the Cost field minus the Baseline Cost field, so it’s a positive value when the project or task is over budget.
You can look at earned value measures in several places.
- The Earned Value table shows earned value measures for every task.
- The Earned Value Cost Indicators table includes basic earned value fields and adds CV% (CV as a percentage of the planned value), Cost Performance Index (CPI), and To-Complete Cost Performance Index (TCPI).
- The Earned Value Schedule Indicators table includes planned value (BCWS), earned value (BCWP), plus schedule-oriented measures, such as Schedule Variance (SV), Cost Variance (CV), SV%, and Schedule Performance Index (SPI).
- The Earned Value Over Time visual report initially shows the graph of earned value over time. You can modify this report to show earned value for specific time periods or specific tasks.
Think You Know Variances? Test Yourself!
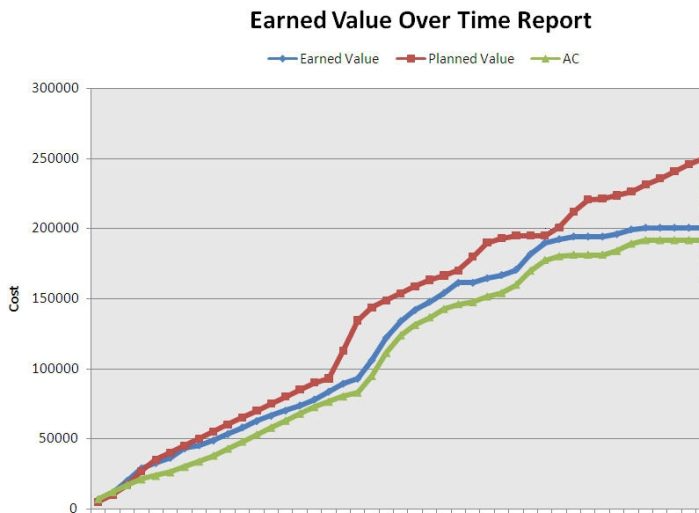
The earned value graph for your project looks like the one here. Where does the project stand in terms of schedule and budget

A: The project is over budget and behind schedule.
B: The project is under budget and ahead of schedule.
C: The project is over budget and ahead of schedule.
D: The project is under budget and behind schedule.
No peeking! Scroll below the book ordering information to read the answer to this quiz.
Order the MCTS Self-Paced Training Kit (Exam 70-632): Managing Projects with Microsoft Office Project 2007.
To learn more about Microsoft certification, read, “Microsoft Project Management Certification: How to Get Started.”
Bonnie Biafore is the author of O’Reilly’s Microsoft Project 2010: The Missing Manual and Microsoft Press’ On Time! On Track! On Target! Managing Your Projects Successfully with Microsoft Project. She’sdeveloping a Project 2010 course for lynda.com. As a consultant, she manages projects for clients and wins accolades for her ability to herd cats. You can learn more at Bonnie’s website or email her at bonnie.biafore@gmail.com.
The Answer to Test Yourself!
In this example, the actual cost is less than the planned value, so the project is under budget. The earned value is also less than the planned value, which means that the project is behind schedule.
A is incorrect. The actual cost is less than the planned value, so the project is under budget.
B is incorrect. The actual cost is less than the planned value, so the project is under budget.
C is incorrect. The actual cost is less than the planned value, so the project is under budget. The actual cost is less than the planned value, so the project is under budget.
D is correct.


