This article illustrates the value of using deadlines instead of constraints to make forecasting easier. Constraints make forecasting more difficult because they take flexibility away from a schedule.
Deadlines don’t take flexibility away from a schedule. Whenever possible, I recommend that you use deadlines in Microsoft Project instead of constraints. The use of a Deadline Dashboard enables the user to see schedule and deadline problems before they jeopardize the project. With a Deadline Dashboard we can’t predict the future, but now we can see schedule vulnerabilities.
How to create a Deadline
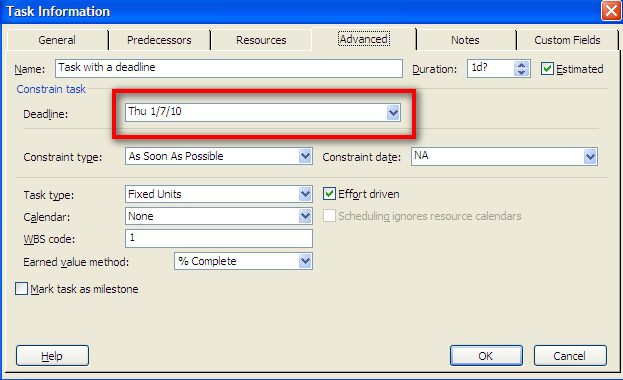
Deadlines are set by typing a date into the Deadline field located on the Advanced tab of the Task Information dialog box. You get to this by double clicking on the task name of the task on which you wish to impose a deadline. See Figure 1 below.
Figure 1: Location of the Deadline field.
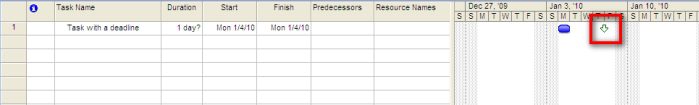
Once the Deadline is entered and OK’d, a deadline marker is noted in the task’s row on the Gantt chart. It looks like an Arrow pointed down. See Figure 2.
Figure 2: The deadline marker.
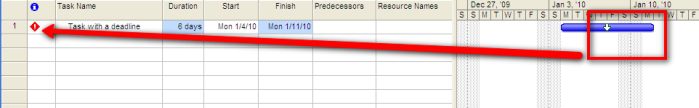
Now that a deadline is set, Project will compare the Finish Date of the task to the task Deadline. If the Finish Date is the same as or later than the Deadline, a graphic indicator will show up in the Indicators field. Project’s default is to show this field just to the right of the ID Number. Holding the mouse cursor over the indicator will give you more details. In Figure 3, the duration of the task has increased to a later date than the deadline, triggering the indicator.
Figure 3: Missing the deadline triggers a warning indicator.
You now know how to set a Deadline. But you’ll only see the warning indicator when the task Finish Date is the same as or later than the Deadline. In other words, if you didn’t notice the Gantt bar’s finish date and the Deadline date converging, you wouldn’t see a warning indicator until the deadline is missed.
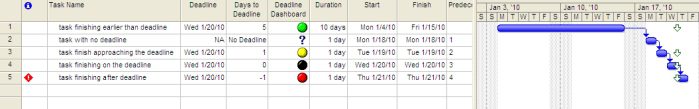
We want to know of an approaching deadline before it tolls, not after. We also want to know how many days we have to the deadline so we can create a contingency plan if schedule recovery becomes necessary. A Deadline Dashboard helps us evaluate the schedule. See Figure 4. The numbers in the “Days to Deadline” field represent the span of time to the deadline. A zero means the finish date is the same as the Deadline date. A negative number indicates the number of days beyond the Deadline date.
Figure 4: A Deadline Dashboard.
Create the Days to Deadline and Deadline Dashboard Columns
The Deadline Dashboard is enabled by creating two custom fields. These must be text fields that contain the formula to count the days to the deadline and evaluate the result to match to a graphical indicator.
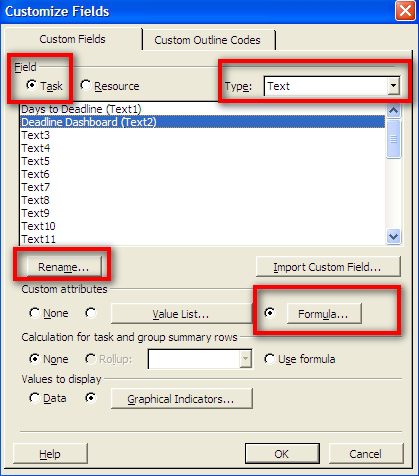
First, customize your Text field by renaming it something descriptive such as “Days to Deadline.” To do this, choose Tools | Customize | Fields to see the Custom Fields dialog box. Make sure the Task field is selected and the Type is Text. Select the first text field you wish to customize and then click on the Rename button. Type in the name “Days to Deadline.” Repeat this procedure for the second text field but name it “Deadline Dashboard.” Once this task is completed, the Custom Fields list should show the two new fields as depicted in Figure 5.
Figure 5: Select and rename Text fields.
How to make a Deadline Dashboard
Return to the Custom Fields list and select the “Days to Deadline” field. Click on the Formula button and enter the formula shown in Figure 6. This formula checks each task to see if it has a deadline. If it does, the number of days to the deadline are calculated and displayed in the field. If the task has no deadline, the warning “No Deadline” will be displayed. Once the formula is entered, click on the OK button. This returns you to the Custom Fields dialog box. Click on OK again. Examine the “Days to Deadline” field. It should now show the number of days to each task’s deadline.
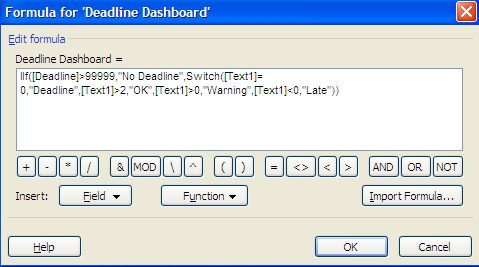
Repeat this procedure on the” Deadline Dashboard” field using the formula in Figure 7.
Figure 6: Enter the formula to calculate the number of days to task deadline.
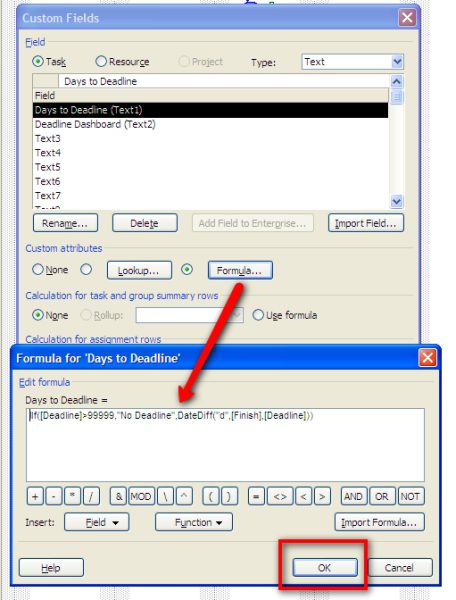
Figure 7: The formula for the Deadline Dashboard.
Creating the Graphical Indicators
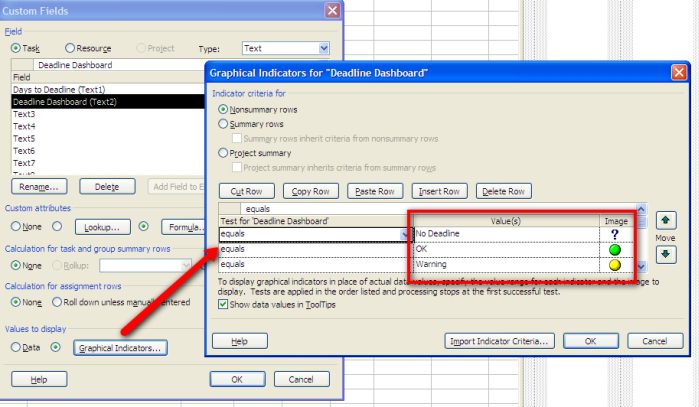
Graphical indicators represent the result of the “Days to Deadline” formula and set the type of graphic to be displayed for the results. For example, the green ball represents a finish date for a task that’s more than two days prior to the deadline. A yellow ball indicates the finish within two days of the deadline. You’ll need to enter these conditions and the graphics that represent them. The Values field must be exactly the same values indicated in the formula for the Deadline Dashboard. See Figure 8.
Figure 8: Create graphical indicators for the Deadline Dashboard.
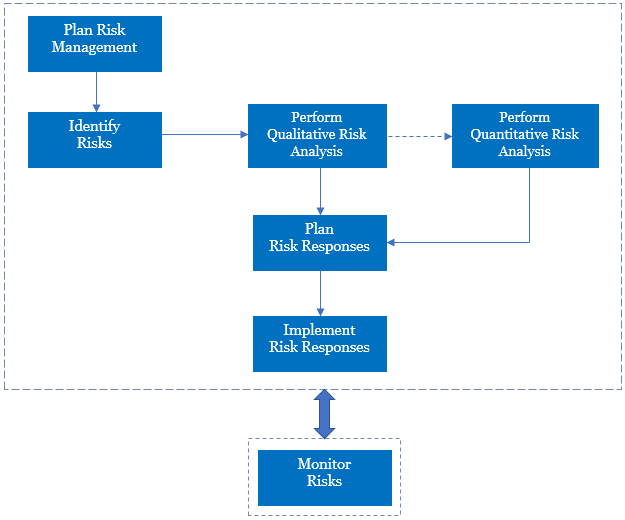
The Deadline Dashboard is a tool to evaluate scheduling and make contingencies. Similarly, using this technique to create a Baseline Dashboard, a Variance Dashboard, and a Cost Dashboard also helps evaluate projects.
Try it out! Let me know if you have questions and if it worked for you.