 We recently discovered a smart psychiatrist named Jon Lieff, during our reading of Good Charts by Scott Berinato. (This book is a treasure trove of information, if you’re interested in learning more about making better charts — a must read for any business professional.)
Lieff inked a blog post in April 2015 titled, “How Does Expectation Affect Perception.” In it, he digs into how our brains are programmed to take information in, and how that programming impacts our interpretation of that information. (Of course, this is a gross oversimplification.)
In presenting Gantt charts and other plan communications, setting expectations is important in ensuring that our audience can absorb the information they require as quickly and easily as possible.
To quote Lieff, “The brain has many interacting pathways and loops that create expectations with different probabilities from our previous experiences. The context and movement in the scene stimulate the brain to prioritize possible future events. It gathers information and then at some point guesses on what is happening and creates the visual scene for our perception. This can be correct or an error. The unexpected event is more difficult to process, because of the bias toward what has occurred recently and repetitively. These competing loops can have many different effects.”
I took the liberty of bolding the words above because they’re the most relevant to the impact of a lack of standardization. Simply put, the more variation we put into our communications to our audiences, the more difficult we make them to process.
We speak to a lot of project-related resources across just about every industry, and across the board, very few have achieved standardization within their reporting. A variety of factors influence this: siloed structures, distributed budgets, organizational churn and false interpretations of “lean,” to name a handful. There are probably people who purchase our application, OnePager Pro, in a company of 10,000 and have no idea that they have a colleague sitting next to them who is an expert in it and has been using the tool for years.
But science says standardization is important to allow our audience to perceive “the visual scene” correctly in business. Without making an effort to achieve that on a practical level, we’re making communication more difficult and error prone.
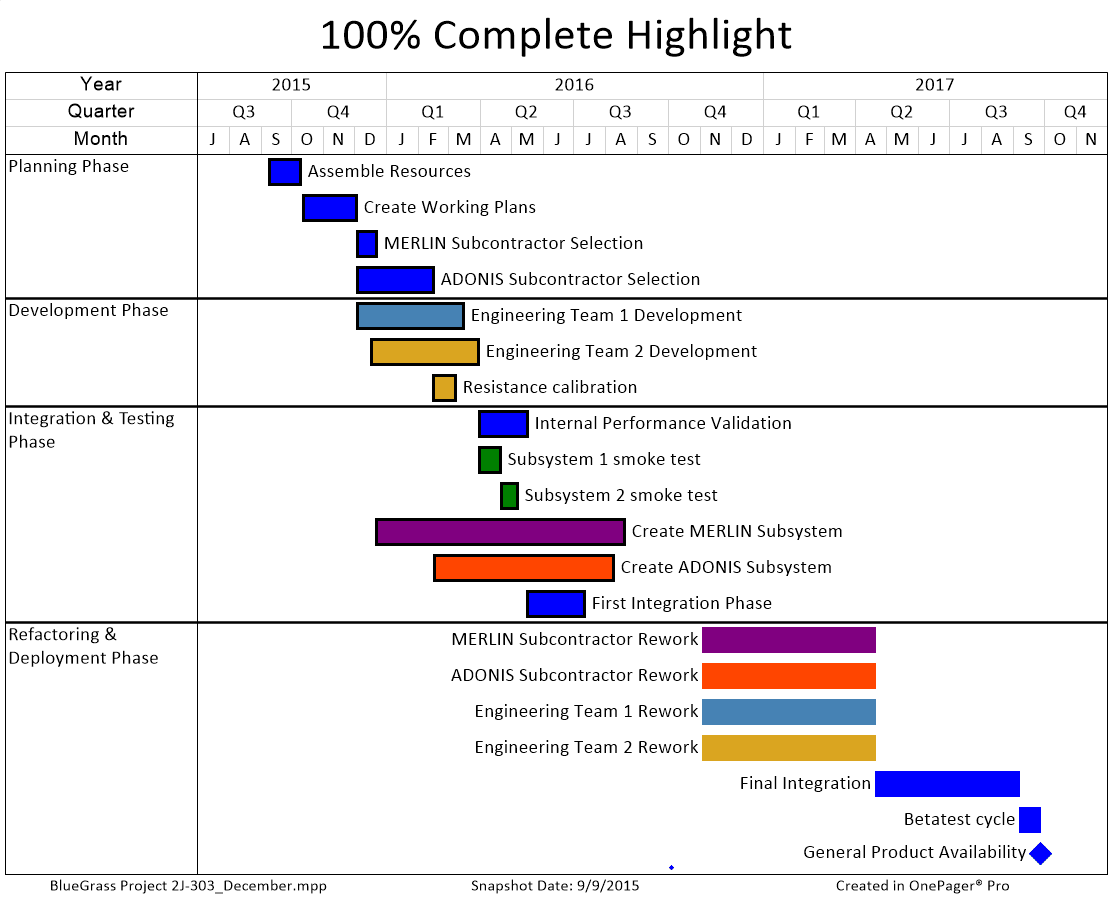
Take the two charts below. In the first, the bold border around the shapes is meant to denote items on the critical path. In the second, the bold border is meant to illustrate items that are complete. If these two charts were presented to the same audience by two different resources at different times, you could see how they would be interpreted incorrectly.
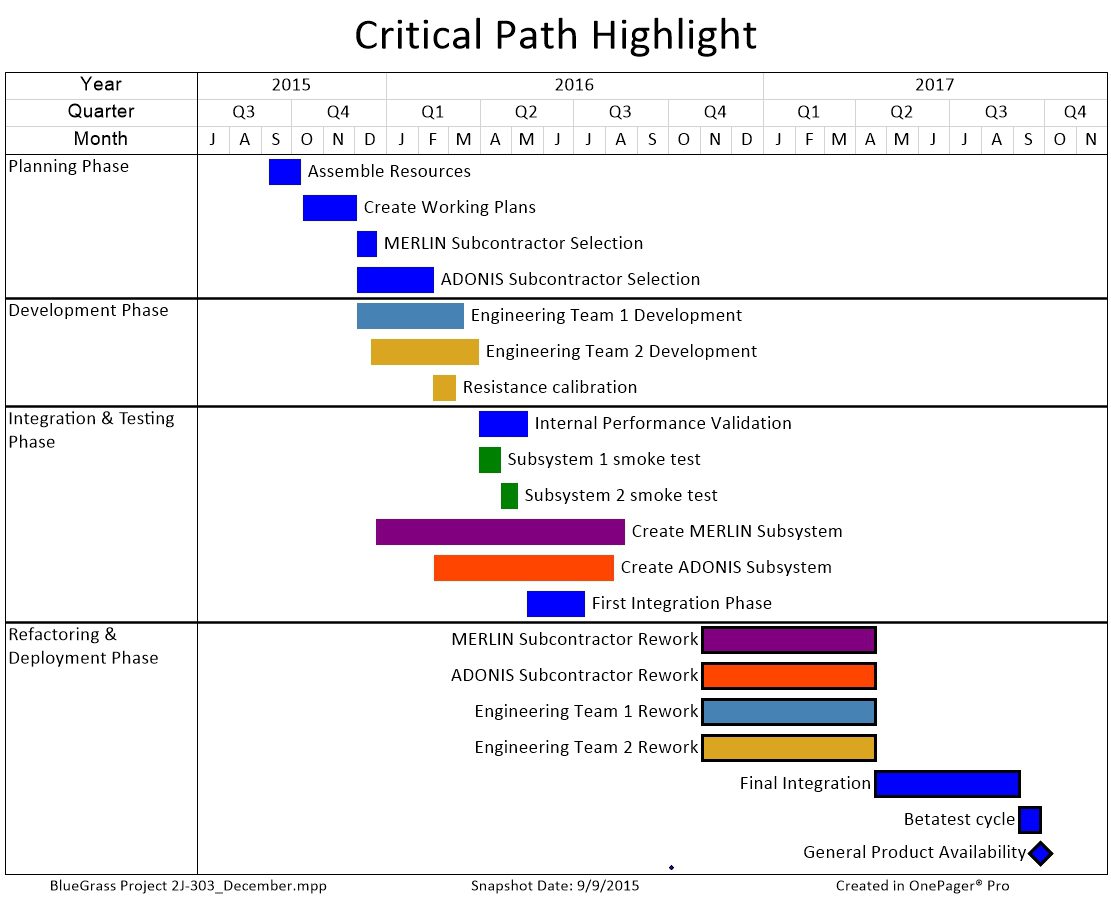
Standardization is the best way to combat this sort of improper yet inadvertent expectation setting.
All it takes is an organizer and a little motivation. If your company hasn’t yet started a user group for the tools you use, we highly encourage you to spin one up! A quarterly meeting for an hour that is just meant to focus on plan communications and content and learning can achieve wonders.
A version of this article originally appeared on the OnePager blog here.