
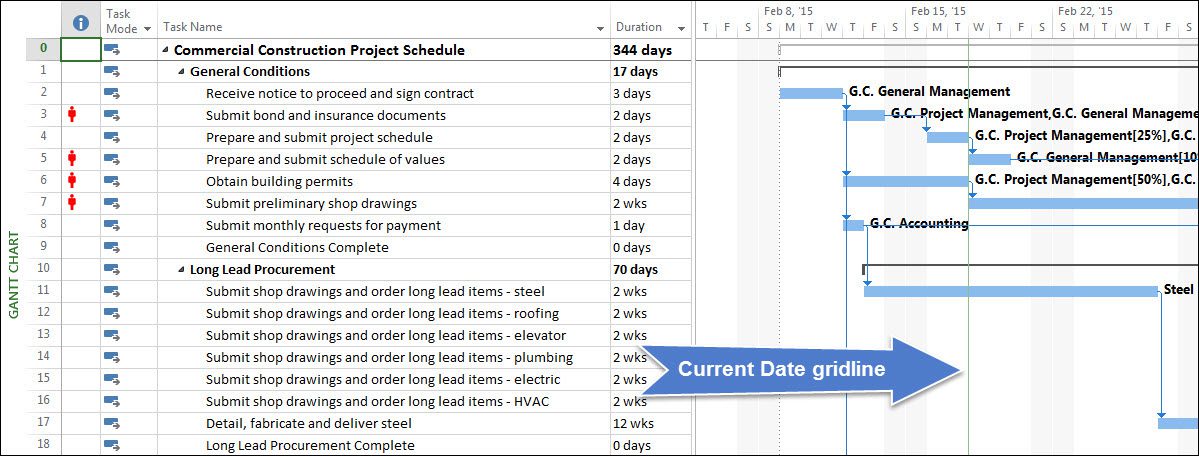
By default, Microsoft Project displays a Current date gridline in the Gantt Chart view. You can see a green Current date gridline displayed on 02-18-15 in the Gantt Chart view shown in the following figure.
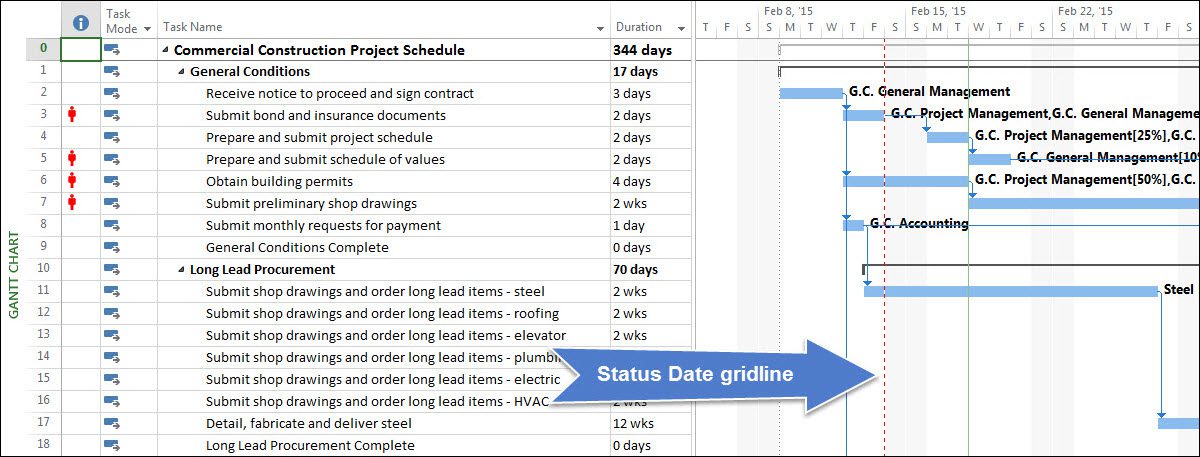
By default, Microsoft Project 2013 does not display a Status date gridline in the Gantt Chart view. If you regularly specify the Status date in your projects as a part of your project updating process, I believe you will find it very helpful to display a Status date gridline in the Gantt Chart view of your projects.
Note: Before you can display the Status date gridline in the Gantt Chart view, you must actually set a Status date value in each of your projects. To do this, click the Status Date button in the Status section of the Project ribbon, select a date in the Status Date dialog, and then click the OK button.
To display a Status date gridline in the Gantt Chart view, complete the following steps:
- Apply the Gantt Chart
- Click the Format tab to display the Format
- In the Format section of the Format ribbon, click the Gridlines pick list button and select the Gridlines item on the list. Microsoft Project displays the Gridlines dialog shown in the following figure.
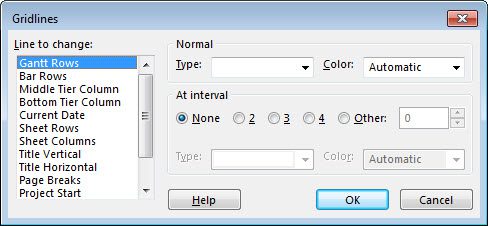
- In the Gridlines dialog, scroll to the bottom of the Line to change list and select the Status Date
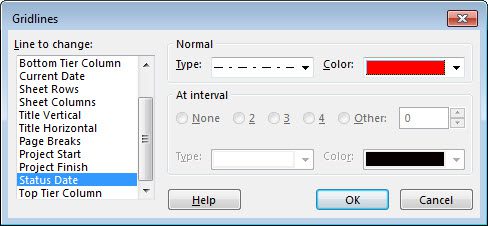
- In the Normal section of the dialog, click the Type pick list and select one of four line types (I personally like to use the last line type on the Type pick list in Microsoft Project 2013).
- In the Normal section of the dialog, click the Color pick list and select the color for the gridline (I personally like to use the red color in Microsoft Project 2013).The following figure shows my settings for displaying the Status date gridline in the Gantt Chart view.
- In the Gridlines dialog, click the OKMicrosoft Project displays a Status date gridline in the Gantt Chart view, such as the one shown in the following figure.
A version of this article originally appeared on the Sensei Project Solutions blog.


Nenad Trajkovski
Dale,
I planned to write a short Blog next week about that, but you were faster. 🙂
Regards, my dear MVP friend
Vahid Einifar
Is there any widget that takes these quick tips for Project 2013, and provide them for 2007?
Trevor Rabey
Dale,
Very good tip. So simple yet so useful, and one I have been advocating for a very long time. And because this vertical line marks the boundary between past and future, it makes it very clear why there should be nothing scheduled to the left and nothing actual to the right, because nothing can be planned to be done in the past and nothing can be said to have been done in the future.