 Are you a new or experienced user of Microsoft Project who has struggled with the views, reports, and/or printing options that come with the product?
I’m excited to share my upcoming webinar series that will help you master (Microsoft) Project visualization. Join me as we jump into the three main areas of visualization that MS Project offers.
The series consists of three webinars, each week I’ll dive into a topic that will help you get a better understanding of visualization in MS Project.
In this practical webinar, Erik van Hurck helps you create the best views for your specific needs. We will learn the differences between tables and Views, as well as dive into creating Groups and Filters the correct way.
At the end of the session, you will be able to create completely new filters, tables, and views. And, you will also be able to alter existing ones!
Microsoft Project 2013 and up contain a very powerful reporting module. Erik van Hurck will share three tips to make the most of the reports and “Wow” your management team with better looking results.
At the end of the session, you will be able to create stunning reports and share them with stakeholders.
Even in the age of Wearables, AR, and tablets, there is still sometimes a need for a paper version of your schedule. In this short wrap-up session, you will learn how to get a good printout.
Is this for you?
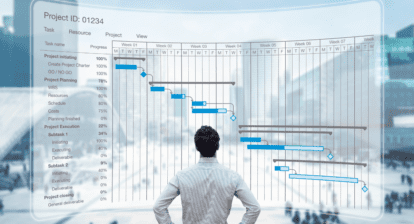
Are you a frequent user of Microsoft Project? Maybe a Project Manager, Scheduler, or PMO member? Have you ever wondered if you can group activities by resource department? Or maybe you wanted to highlight critical sections within the schedule when producing documentation?
This webinar series will help you navigate through your schedules with ease. You’ll learn how to produce visualizations of progress that your stakeholders and management will love.