
Turning the whole system into something greater than the sum of its parts
In the first part of my article, we covered how the selection of projects is crucial to Project Portfolio Management (PPM), and we saw firsthand, by looking at a few case specific scenarios, how true this is. But, what about the financial formulas available in MS Excel and Project? Let’s consider how they play into this analysis.
Microsoft Excel and Project
Excel has many great financial formulas (i.e., =XNPV(rate,values,dates)) that are easy to use and should be used as tools for project portfolio selection. Two formulas that are related, but just “estimates” are XNPV and XIRR (or Internal Rate of Return). You must be careful when you use them, so you are not misled. As I said, they are just estimates. The main difference between the two is that XNPV calculates the value of the business today, and XIRR calculates how fast the business or rate appreciates in value (i.e. its rate of return).
Microsoft Project interfaces with Excel (and Visio) offering many different kinds of visual reports showing financial information in bar graphs, pie charts, and/or line graphs. These can be very useful in project status meetings. To generate these reports in Project, go to the Report tab’s Export section and then click Visual Reports. The financial Excel reports include: baseline cost, cash flow, earned value over time, and resource cost summary. Furthermore, these reports can be customized as needed and saved as Excel files.
There are three main NPV categories (Revenue, Operating, and Competitive Necessities) that you will find below in selecting what projects to work on, and these should be listed in Project’s first line (WBS = 1) under Notes. To do this, right click the first line, select Information and the Notes tab, and copy/paste the selected project’s NPV Excel data in it. I recommend doing this for historical reasons (i.e. why this individual project was selected) so that you’ll be able to provide evidence in legal proceedings, if needed. Additionally, you can later test your cost/NPV selection process to see if it’s correct or needs tweaking. See Table 1.7 below for an example.
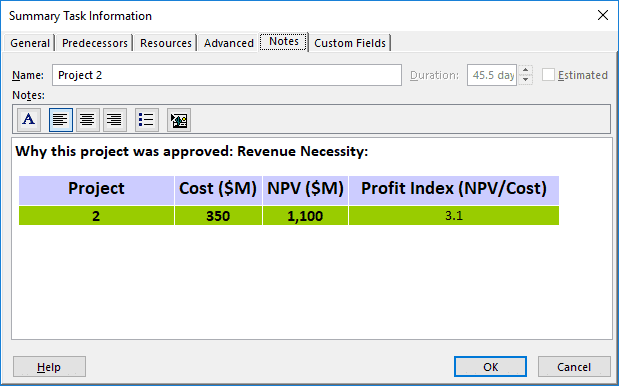
Table 1.7: Why Project 2 was Selected
NPV Categories
- Revenue Necessity: This refers to selecting projects (from Table 1.6) that have the highest Profitability Index. Most companies want to decrease costs and increase revenues as much as they can.
- Operating Necessity: Sometimes an organization has to go against its formal project decision-making process because of external or internal factors. For example, Tables 1.4, 1.5, and 1.6 have the same ten projects that were prioritized and showed the best projects based on their own selection criteria. Let’s say project 10, which was not selected in Tables 1.5 and 1.6, is a new mandated U.S. federal law like the Sarbanes-Oxley Act or the Dodd-Frank Act (both related to corporate compliance on financial regulations). Of course, because of the nature of the project, this one needs to be incorporated into your operations.
This means that you would use your selection criteria on the first nine projects. In a different scenario, let’s say Project 10 has been approved (another free-pass) by your board of directors and/or CEO to improve the company’s public image, which may be at a very low point. In this case, again this project would have to be implemented, which means you would use your selection criteria on the first nine projects. Other “free-pass” projects may include advoiding litigation, addressing regulatory issues, and reducing exposure.
- Competitive Necessity: These projects are similar to Operating Necessity projects, but are less critical. Competitive Necessity projects are usually in response to a competitor’s actions or a change in technology or markets that could lead to a new strategy for the organization. For example, computer hard drive manufacturers had to upgrade their manufacturing facilities to change from making hard disk drives (HDD) to making storage area network (SAN) drives. The long-term benefits and savings for their customers were great! The devices took up less than half the rack storage space versus using HDD, time to access data was cut in half, and the data transfer rate doubled. Likewise, if project 10 from Tables 1.5 and 1.6 is an approved competitive one, then you would use your selection criteria on the first nine projects.
Other Financial Decision Considerations
- Payback Period: Capital budgeting refers to the period of time required for the return on the entire investment if the returns are evenly distributed over the years with little or no salvage value. Assume an investment of $500,000 is expected to produce annual returns of $100,000 for ten years. Then, the payback period for the investment to be recovered would be five years. The ratio of the investment to the annual return is 5:1. Expressed in another way, the unadjusted rate of return is 20% as follows: the $100,000 returns is divided by the $500,000 investment, which equals a 20% rate of return. As anyone should see, the math is simple to follow, but the payback period has some drawbacks. For example, it ignores cash flows after the payback period ends and ignores the time value of money. NPV does take into account the time value of money (i.e. the net cash flows at different points in time), which gives a more accurate picture of financial performance.
- Depreciation and Income Tax: Organizations may need to acquire capital assets that are depreciable for income tax purposes over a period of accounting periods. Assume a new host computer costs $500,000 with a life expectancy of five years with no trade-in or resale value at the end of five years. The annual tax deduction for depreciation would be $100,000 ($500,000/5) for five years. If there is a trade-in or resale value at the end of five years of $100,000, then the annual tax deduction for depreciation would be $80,000 (($500,000 – $100,000)/5). The possible tax effect of depreciation must be considered when making investments especially when depreciation deductions will reduce annual cash out-flows by paying less income tax.
- Reducing Risks: One of the main keys to PPM is to diversify investments in such a way as to reduce the overall risks within a portfolio. While it’s important to optimize the total financial value of projects within a portfolio, you still want to minimize the risk exposure by having early and frequent risk reviews for each project. Also, it’s important to be aware of your external risks (i.e. customers, suppliers, competitors, industry, and economy) and internal risks (i.e. resource estimations, schedule estimations, scope definitions, and scope creep). As one can see, reducing risks is part of portfolio balancing and optimization that should be done on a regular basis. It’s important to always remember some things will go wrong in pending and approved projects within an organization. Of course, it’s easier and faster to expect such issues and have a plan for how to respond.
Summary
Many companies still use unscientific approaches when it comes to PPM evaluation and selection. These approaches usually lead to wasted monies, resources, and unfavorable politics. Having formal methods for portfolio evaluation and selection, such as those described in this article, will go a long way for your organization and help to eliminate much of the political flavor in project selection. PPM should improve your project selection process, give you a better understanding of project value, and could help you obtain funds for a project. As much as possible, you should always want to pick projects and programs that meet your organization’s strategic goals. Be aware that many companies’ strategic plans are more like mission or vision statement than a road map, and very few companies do “post audits” that could confirm whether investments actually paid off. Even if a post audit showed negative financial outcomes, it might expose a manager’s data gathering errors and manipulation efforts.
It’s important that portfolio managers have solid financial and analytical skills and understand how projects and programs can increase NPV (or other selected financial formulas) while supporting strategic goals. Furthermore, portfolio managers might consider getting certification through PMI as a Portfolio Management Professional (PfMP) to increase their skill level and/or future opportunities. There are only about 400 holders of this certification, and in my opinion, there should be more. Another PMI certification to consider, one of which there are about 2,000 holders, is the Program Management Professional (PgMP) certification.
Since the PPM approach is not a “one-size fits all” solution, your organization should research other optimization methods and models for PPM evaluation and selection to find their best value equation. This could include integer linear programming that will maximize or minimize some target area, what-if-modeling, and/or software that shows inter-project dependencies to understand what is going on in other projects. All of these considerations will lead to better resource allocation. Most of these features can be found in project-portfolio software products like Microsoft Project Portfolio Management (microsoft.com) or Primavera Enterprise Project Portfolio Management (oracle.com). Some of the functionalities include staffing projects from a common resource pool and tracking activities on multiple projects to show inter-project activity dependencies. More importantly, these tools can assist in the selection of the right mix of strategic projects. Another advantage to having this kind of software is having common project communications (i.e. tracking reports and accomplishment reports). This common language fosters team collaboration throughout the organization by promoting well established project-management and data-oriented policies, processes, and procedures.
The people running PPM need to learn to communicate better to build trust and to insure their messages are clear and understandable within their organization. Communication management should always include rich visual dashboards that have hyperlinks to allow people to drill down on their own time to see more detailed information. These dashboards (i.e. pie charts, Gantt charts, and status indicators) will help a PPM to deliver status information in a precise and timely manner.


Martin Smit
Thank you for sharing your knowledge and experience Ronald!