Reggie Brown asks, what are some methods to produce custom reports with Microsoft Project 2003 and 2007 data?
Answer: Both versions of Microsoft Project allow various ways of creating custom reports, whereby Project 2007 offers a brand new feature called “Visual Reports.” I won’t cover all reporting capabilities available within Project by utilizing the Group and Filter functionality. I will cover the ways of creating an actual report in a different format to Project. Here are some ways of producing a custom report using either Project 2003 or 2007.
The Reports Feature
The reports feature allows users to create pre-defined and custom reports. You’ll be able to find the report link in Project 2003 under View | Reports and within Project 2007 under Report | Reports. By choosing the reports link you’ll be prompted with the reports dialog window, as shown in Figure 1.
Figure 1: The reports dialog window.
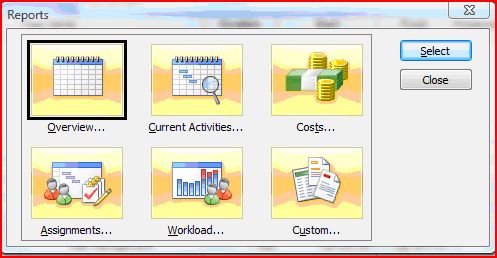
Check out the predefined reports, which are already very good. Additionally, you’re able to create your own reports using this function.
The Analysis Feature
The Analysis feature allows you to copy a picture (such as a Gantt chart) into a Microsoft Word, PowerPoint or Visio file. Additionally Project 2003 gives you the ability to analyse time-scaled data in Excel (a feature replaced with the visual reports in Project 2007). These functions allow you to extract data or pictures easily for usage with other Office files for presentation or analysis purposes. You can find this feature by right clicking on the Tools bar and choosing “Analysis.”
Figure 2: The Analysis feature is tucked under Tools in the menu.
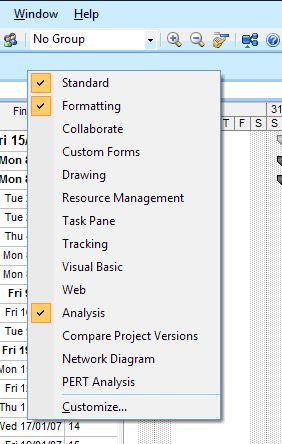
Once you’ve chosen “Analysis,” you’ll see the menu bars shown in Figures 3 and 4 in your toolbar.
Figure 3: The menu for Project 2003.
![]()
Figure 4: The menu for Project 2007.
![]()
The Save As Function
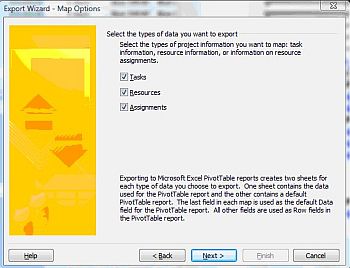
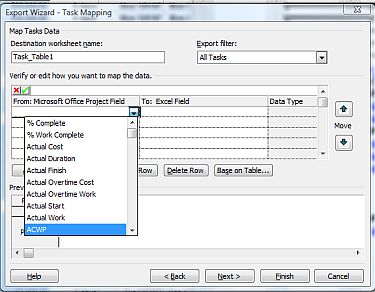
Both versions of Project 2003 and 2007 allow you to save your Project file in many different formats. These formats can allow you to create reports based on your Project file. Go to File | Save As and under the “Save as type” choose your preferred file type (for example, Microsoft Excel Pivot Table). Project will guide you through an export wizard allowing you to specify if you want to analyse Tasks, Resources, or Assignments. Based on your selection, you have the ability to create great Excel reports and more.
Figures 5a and 5b: The Save As function.
Visual Reports
Visual Reports, new to Project 2007, allows you to export Project-related information into either an Excel or Visio Format. This feature has proven invaluable for project managers since its introduction. You can find this feature under Reports | Visual Reports. You’ll be prompted with the Visual Reports dialog window.
Figure 6: The Visual Reports dialog window in Project 2007.
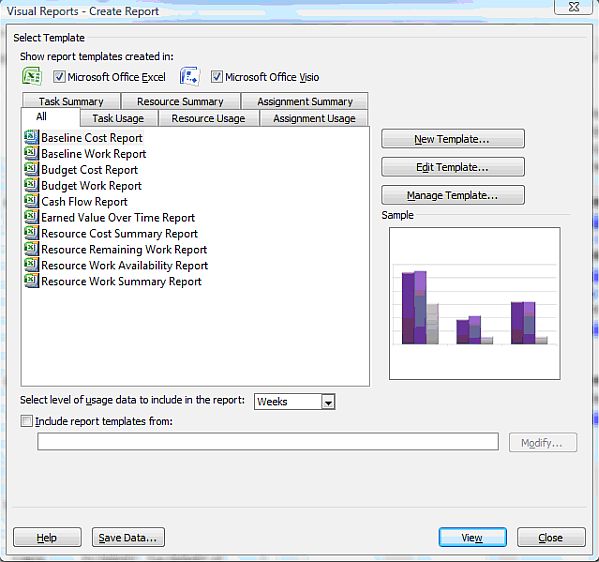
Project 2007 has pre-defined templates, but also allows users to create their own report templates. This feature, together with Excel 2007 and Visio 2007, has become an efficient way to analyse and report against project progress. My example below represents a “Cash Flow” report, a report most important for many organisations.
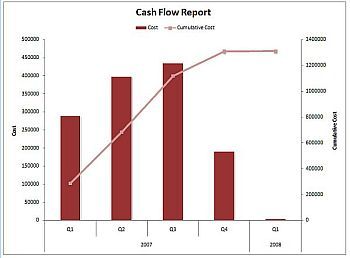
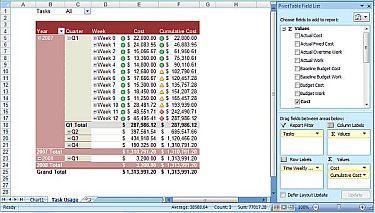
By selecting the template” Cash flow report” and selecting the “View” button, the visual report will automatically be created based on the great Excel pivot table feature. Excel will open and display the cash flow report based on your Project file.
Figures 7a and 7b: A cash flow report and its Excel equivalent.
By using the power of Project and Excel you’ll have the ability to report any data you maintain in your schedule.
A Final Note about Project Server 2007
I know that Reggie’s question is more about Project, but it’s important to remember that Project Server 2007 allows organisations to easily report project and program data by using the 14 OLAP cubes (pivot tables) that come out of the box and a fully dedicated Reporting Database. This dynamic duo allows organisations to create any reports you require or just plain desire.