Question: I seem to use only the Gantt chart view. Are there other ones that could help me manage my projects?
Answer: In fact there are several that are standard in all levels of Microsoft Project that will help you at different stages of managing your projects. Keep in mind that a capability of the software is to give you more information to work with sooner so you have time to react and head off future problems. These views were designed to give you some of this information. With any project file open, try some of these views.
All views may be reached through View | More Views. To add views you would use frequently to the View menu, select the view in the More Views form, click edit, put a checkmark in Show in the Menu and click OK.
Gantt Chart: This view is the default view for many and is used primarily for planning.
Enterprise Gantt Chart: This will look the same as the Gantt Chart but is actually part of the global template in the enterprise version of Project. This version may only be customized by the Microsoft Project Administrator or by someone with permission to change this view.
Tracking Gantt: this view is formatted to show Baseline vs. Planned timelines as well as percent complete per task. The percent complete is duration completed, not work completed per task.
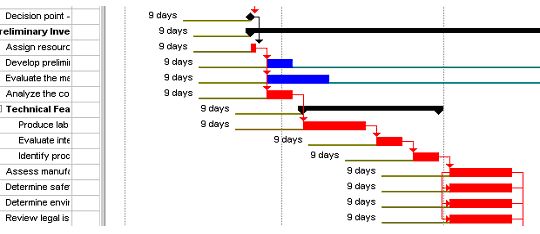
Detail Gantt: This view is formatted to show slippage and slack compared to baseline. These are portrayed as thin lines in olive or teal on either side of the Gantt bars. A baseline must be set for the view to be beneficial. To help derive more information from this view, consider adding the column Total Slack to the table. Any value in negative numbers will represent how much you will be missing your deadlines by and time that must be made up to hit your targets.
Figure 1. The Detail Gantt view.
Leveling Gantt: This view will show the results of the resource leveling process. See below:
Figure 2. The Leveling Gantt
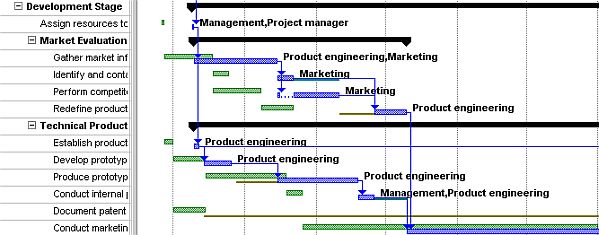
The green bars are what the schedule looked like before the leveling process was performed, and the blue bars represent the result of leveling the schedule. You can determine if the leveling suggestions will be advantageous or not for your schedule. You may always remove leveling, so it’s useful to give it a try.
Multiple Baselines Gantt: The active baseline will use the Baseline fields. I recommend setting the original baseline twice — once in the baseline fields and once in baseline1 fields:
To set, go to Tools | Tracking | Save baseline | Select Baseline1 | click OK.
If both baselines have been saved, you will be able to view them in this view. It will give you the benefit of seeing your original starting baseline (baseline 1 fields) and compare it to the running baseline that will be updated with project changes (baseline). Best use for this view is lessons learned — the where-did-we-start? and where-did-we-end-up? comparisons. The view is formatted for three baselines (Baseline, Baseline1 and Baseline2) so different pictures may be taken at different timeframes. Also, the view could be formatted to show more if required.
Bar rollup Gantt chart: Rolls the tasks up to the summary bars for a consolidated view. Best use is very large projects. Any task that will be rolled up will have in the general tab the flag, “Roll up to Gantt bar in Summary selected in the task information box. The Rollup_formatting Macro needs to be run to create the roll ups.
Milestone Date Rollup and Milestone Rollup: Rolls the milestone up to the summary bars as diamonds. See the “Bar rollup Gantt chart” above for flags and macro instructions.
You always have the option to create your own view that will show your unique requirements. I would recommend copying any custom views into the Organizer (Tools | Organizer) to save it to your local global values and allow usage with other project schedules.
I would also encourage you to look to Microsoft Project help for customization suggestions and more usage information about each of the above views.