
I’ve created my fair share of Project, Program, and Portfolio Reports. Based on that knowledge, I wanted to share with you some common issues I notice within organizations. I hope, as you read these, you’ll see if they apply to your organization, be able to improve based on this article, and let me know if you have additional advice or agree/disagree in the comments below.
1. Don’t hide behind the green KPI
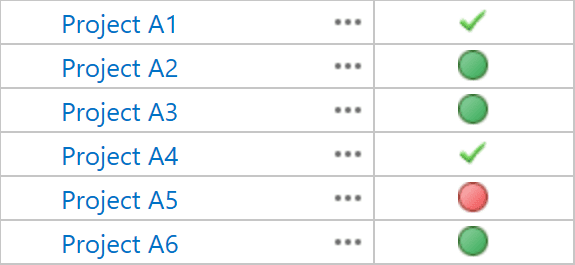
Every organization that I have helped so far has a need for KPI values. The famous Red, Amber, Green.
Most off the time I will add two additional values called “Unknown” and “Completed”. In particular, the “Unknown” value (set as default) is a nice trigger to get Project Manager’s thinking about the status of their projects.
But!
As soon as the project is on its way, PMs tend to hide behind the green KPI value, believing that setting the marker to red or even amber will make them a worse Project Manager. Don’t make that mistake! Setting values to amber or red make your stakeholders and managers aware of the fact that the project needs more care, budget, and/or resources. Hiding behind the green will result in not getting that extra care and it could become too late.
Use these three methods to combat this issue”
- Make the KPI’s formula based thereby setting the values to compare with baseline information, for instance. The thing to be aware of with this approach is that a lot of organizations find it difficult to set a standard for these values. Is Amber +5% budget… or +15%? And can this differ between project types? That’s always an interesting discussion with clients.
- Change the culture of the organization to one where there is not a punishment atmosphere around setting “negative” values. This will give people leave to be honest about the values they set in the schedules thereby speeding up the ability to establish “repair” scenarios.
- Implement textual values to be incorporated with the RAG indicator, and if you are really into “the future that is now” approach, use AI / machine learning to read and interpret the sentiment of the text. At Projectum, we did this recently as a proof of concept. There were interesting results. A certain percentage of Project Managers were far less optimistic about the status than they let on purely the way they reflected the RAG value.
2. Don’t fall into a data overload
There’s a point in time during a vision workshop that we all come to the question, “What would you like to report on?” A common response is “Everything!”
This creates a situation where so much data is gathered and put into Power BI reports that the reports themselves become overloaded and obsolete.
Just imagine a page that contains 10+ visuals (Tables, Pie charts, data cards, slicers, graphs, etc.). There is no quick and easy way to interpret the data provided.
Luckily, Power BI has introduced three new features in their Desktop reporting tool: bookmarks, selection pane, and spotlight.
With these features, the user is now able to highlight important aspects of the report and bookmark them. Using the Power BI Service, you will then be able to create a kind of storyboard. This walks the viewer through the data without overburdening him/her.
3. Don’t forget to tailor your reports to the company hierarchy
CEOs, Managers, and Project Managers all get the same reports? Why? Does your CEO need to know about every task that finishes on any specific timeframe?
Rather than creating one report for everyone, create reports that are dedicated to supply the right data to the right level in the organization.
The CXO level needs to know how the company is doing. So, you would likely include:
- An overview by department including overall status, risks, and financial status.
- A table with a single line per project within each department showing KPI’s and changes compared to the previous period.
- Key risks and issues that need C level engagement.
(Department) Managers need an overview on how the department is performing. You would likely include:
- A more detailed overview of all projects in the department / portfolio:
- KPI values on the project
- Budget vs actuals vs forecast
- EAC & ETC values
- An overview of resource allocation in the department with an overview of over- and under allocations.
- Key risks and issues that pertain to the department level.
Project Managers need to get into the nitty gritty of their projects and the resources that are assigned to them. This will include:
- A detailed overview of all projects they manage:
- Financial status budget vs actuals vs forecast
- Estimations on the near future, such as upcoming milestones
- Baseline delta’s on duration, dates, work, and costs
- A detailed overview on the resources that are claimed for their projects.
4. Don’t reinvent the wheel
When designing reports, have a look at what’s already out there and build on top of that. Project Online now has a great new portfolio report content pack that is very well described in the following articles:
Figuring out what you need to report on is a difficult and often lengthy process. I would rather advice that you use the default content pack as a starting point. Locate the missing pieces and build on top of what’s already there.
Adding meta data to filter and sort on is easier then designing the visuals from scratch.
Final thoughts
Designing reports for customers is one of my favorite things to do. The main reason for this is because once the environment is configured and the first real projects get updated in the system, people start asking themselves “What am I doing it all for?” The answer to the question becomes apparent with the reports that we create for them, and that answer is:
“Create visibility on the past, present, and future of your projects and the organization as a whole.”
Keep a look out for my next article, where in I will dive deep into misuse of templates. This was originally intended to be included in this article on reports, but I got a bit carried away with the content on this one.
Hope to see you next time.
Related Content
Webinars (watch for free now!):
Report Basics: Build an Agile Kanban Board in Microsoft Project
It’s All About… Reports!
Articles:
Create a Monthly Cash Flow Report in Microsoft Project 2013
Creating Milestone Reports in Microsoft Project
Creating a Custom Report in Project 2013: This Week’s Tasks


Mark M. Webster
Good points and let me add that anyone who insists on using a subjective RAG indicator is not a serious player. Take the time to define the KPI and make its evaluation programmable – add fields if necessary – and remove the ability to override. Status is what it is. If the PM or others believe that the indicator is wrong, fix the data.