
A Gantt chart is a popular project management tool that is used to visualize the duration, progress, and dependencies of tasks in a project. The chart is named after its inventor, Henry Gantt, who designed it as a way to visually track the progress of a project.
Basically, a Gantt chart is a bar chart that shows the start and end dates of tasks. Each task is represented by a bar, and the bars are arranged in order of when the tasks need to be completed. This makes it easy to see which tasks are dependent on each other and to make sure that all the tasks are completed on time.
If you are looking for a project management tool that can help you visualize the tasks, duration, and dependencies of a project, then a Gantt chart is a good option to consider.
The components of a Gantt Chart
Gantt charts are an effective way to plan and track the progress of a project, as they provide a clear and concise visualization of the tasks, duration, and dependencies of a project. Gantt Charts tool can be used to identify potential issues and bottlenecks in a project.
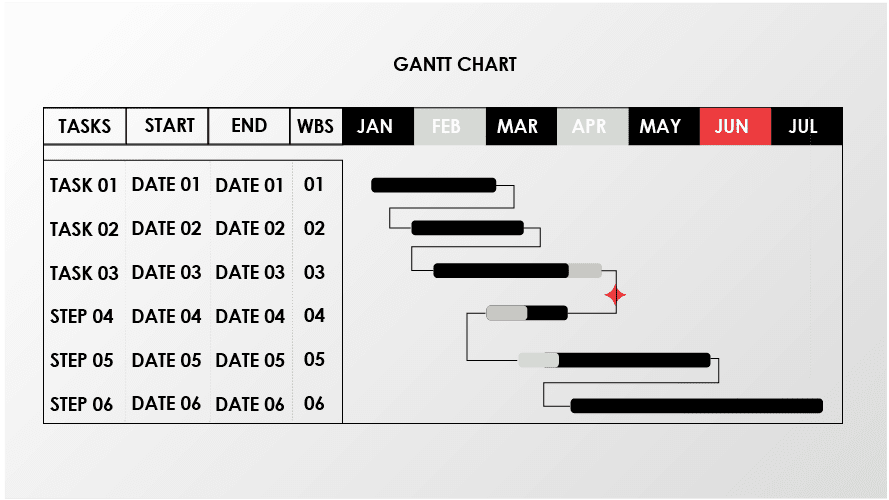
Our example of a gantt chart is a simplified version. Gantt Charts can contain more elements. The components typically found on a gantt chart can be broken up into the following :
- The start date of the project schedule
- What the project tasks are
- Which team member is working on each task
- When activities start and finish
- The percent complete for each activity
- How tasks group together, overlap and link with each other
- Task dependencies such as finish-to-start, start-to-start, finish-to-finish and start-to-finish
- Milestones and project phases on the schedule
- The critical path of the project
- The finish date of the project
In the above lists, the elements found in our example are highlighted in bold text.
Read How to Create an Amazing Gantt Chart in Power BI
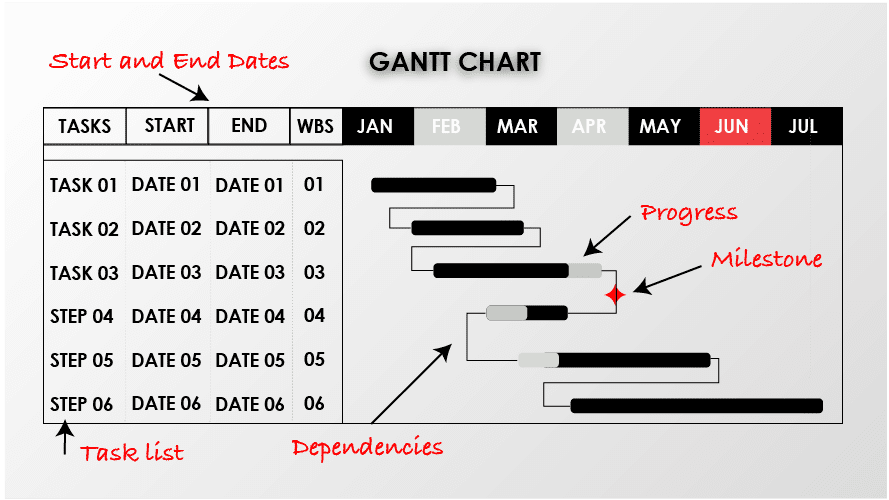
1. Task list
The task list is probably the most important component of a Gantt Chart. A summary of the tasks is displayed on the Y-axis of the Gantt Chart.
Tasks are typically assigned to one or more people. It can be simple, like a to-do list for household chores, or more complex, like a project plan for a work task. They are often used in combination with other productivity tools, like calendars and email, to help people plan and track their work.
Bigger tasks can be sub-divide into smaller tasks to make them easier to manage. You can also sub divide a task after a project has commenced if you need to interrupt work on a task . Sub dividing the task allows the rest of the task to be completed while the interrupted part starts later in a project.
2. Start and End Dates
The start and end dates for a project task are very important. They let assignees know when a task is due and help the project manager plan work accordingly. The start date is the date when the task is scheduled to start, and the end date is the date when the task is due. By completing the task dates, project managers can determine the project duration.
It is important to note that the start and end dates are not always the same. Sometimes a task may be due before it is started, and sometimes a task may be started before it is due. This is why it is important to pay attention to both the start and end dates when planning your work.
If you have any questions about a project task’s start and end dates, please feel free to ask your project manager.

3. Project Timeline
Once you have added your tasks to your task summary and assigned start and end dates to them, a visual timeline will be created depicting the start and end dates of your task, know as your project schedule. Depending on the tool you use, you can drag and rearrange the times to suite your requirements.
4. Project Milestones
Project milestones are a feature of Gantt charts that allow you to visualise the timeline of your project at a high level. By adding project milestones to your Gantt chart, you can see at a glance when major deliverables are due, and track the progress of your project as a whole.
Project milestones are typically represented as diamonds on a Gantt chart, and can be accompanied by additional information such as the name of the milestone, the responsible party, and the target completion date.
Adding project milestones to your Gantt chart can be a great way to keep your team on track and ensure that your project is progressing as planned. If you’re not sure how to add project milestones to your Gantt chart, consult your project management software documentation or ask your project manager for help.
5. Task Dependencies
Task dependencies are the relationships between tasks in a project. In other words, they are the tasks that need to be completed before other tasks can begin. Task dependencies are represented by arrows in a Gantt chart.
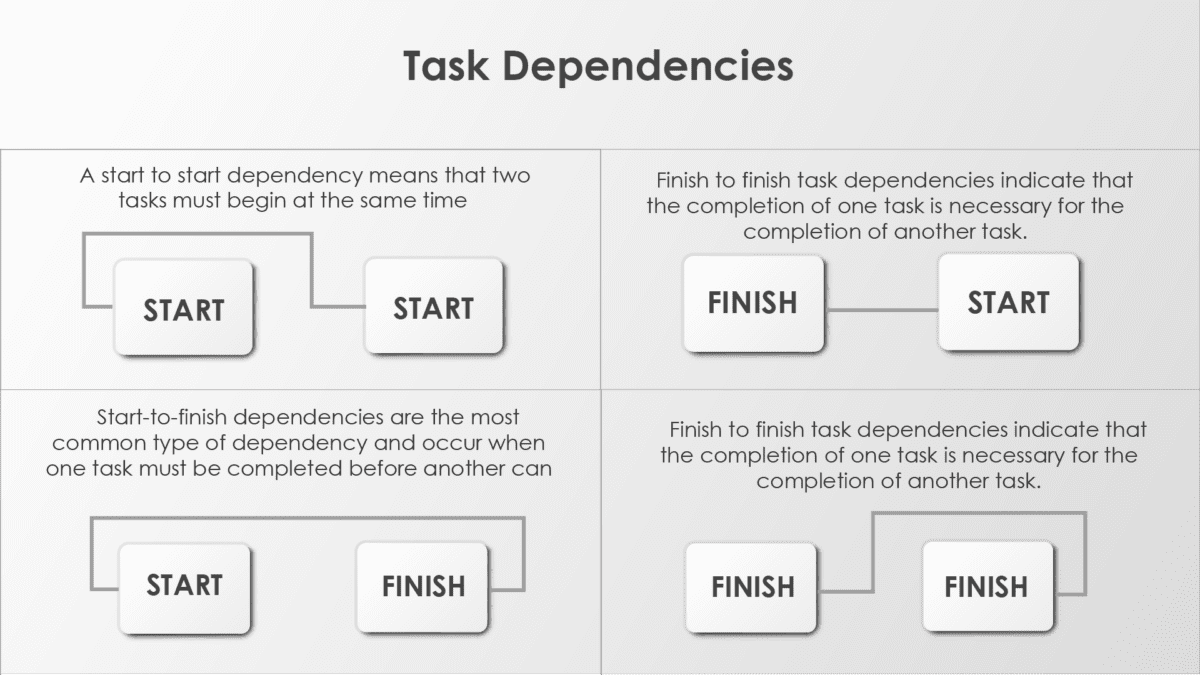
There are four types of task dependencies:
- Finish to start: This is the most common type of task dependency. In a finish to start dependency, one task must be completed before another can begin. For example, in a construction project, the task “dig foundation” must be completed before the task “build walls” can begin.
- Start to start: A start to start dependency means that two tasks must begin at the same time. For example, in a software project, the task “design interface” and the task “write code” might need to start at the same time.
- Finish to finish: Finish to finish task dependencies indicate that the completion of one task is necessary for the completion of another task.
- Start to Finish: Start-to-finish dependencies are the most common type of dependency and occur when one task must be completed before another can begin.
5. Assign tasks to members
Once you have set your dependencies you can start adding members to your project and assigning tasks to them. Assigning task to members is an effective resource management technique that ensures no one is being left to do nothing and everyone has a clear guidelines of what they have to do and by when.
How to use a Gantt chart in Project Management
Gantt charts are used in a wide array of industries, including :
- Marketing
- Construction
- Human Resource
- Event Planning
- Mobile App Development
These are just a few examples of professions where Gantt Charts are used. Project management remains the most common industry for the use of Gantt Charts.
To determine the critical path
One key feature of a gantt chart is that it allows project managers to identify the critical path to project completion. The Critical Path Method (CPM) is a project management technique that helps you identify the most important tasks in a project and the order in which they should be completed. By identifying the critical path early, a project manager can ensure the tasks that require the most attention are focussed on and avoid situations where delays in these tasks can push a projects delivery date backward.
Want to learn more about the Critical Path Method? MPUG has over 500 on demand, pdu eligible webinars to help you learn how to use the Critical Path Method. See our list of Project Management Webinars here
CPM is often used in construction projects, but can be applied to any type of project with multiple tasks and dependencies.
Most popular tools for creating Gantt Charts
While there are many different ways to create a Gantt chart, some tools are more popular than others. The most popular tools for creating Gantt charts include Microsoft Project, Smartsheet, and Wrike. Each of these tools has its own unique set of features, so be sure to choose the one that best meets your needs.
Microsoft Project : is a popular Project Management tool used for project management and is perfect for creating Gantt charts because it offers a wide range of integrations with other apps in its Office 365 suite. See how to Customize your Gantt Chart with Microsoft Project
Smartsheet is another popular option, although it is not as feature-rich as Microsoft Project.
Wrike : is a third option that is growing in popularity due to its user-friendly interface and robust set of features.