In my recent Tracking Starts with a Status Date article, a four-step tracking cycle was defined. It includes setting the status date, entering actuals, rescheduling incomplete work, and resource leveling the remaining schedule.
Before we begin entering actuals, we need a baseline schedule to which we will be comparing actual performance. We also need a status date. The status date is the reference date through which project progress was recorded. Recording what we did is important, and comparing it to what we thought we were going to do allows us to evaluate the accuracy of our forecast.
Where Does Progress Data Come From?
Usually, data about work that was done on a project comes from timesheets or cost accounting systems. VBA macros are used to parse this data and populate tracking fields in Project. The type and quality of tracking data can vary widely. Unfortunately, not all organizations collect this information. Or, if they do, it is not coded in a way that permits easy identification of which project or WBS component it applies to. If you work in an organization that does not collect this information, you may need to collect it yourself. If you do not have progress data, you cannot track.
What Data Do You Need?
There are many variables you can use when tracking: actual start, actual duration, actual finish, remaining duration, actual work, remaining work, actual cost, remaining cost, percent duration complete, percent work complete, etc. The good news is that you may need to record only two or three of these variables per task. Project can compute the rest.
When considering duration, work, or cost while tracking, keep this equation in mind:
Total = Actual + Remaining
Before a task is started, no actual duration, work, or cost has occurred, so the total equals the remaining (or what is planned). Once a task is finished, the total equals what was actually spent and remaining becomes zero. While a task is in progress, the total can change. Therefore, it is important to capture, not only what was spent, but also what remains. For example, percent work complete is a computed value. If you know actual work and total work, you can compute percent work complete. But, if you do not know remaining work for certain, then your total may be in question and the percentage may be incorrect.
Three Schedules: Current, Baseline, and Actual
When you track your project, you have three schedules to manage: current, baseline, and actual. Baseline Start and Finish dates reflect when you thought the task would start and finish. Actual Start and Finish dates show when the task did start and finish. If Actual Start and Finish dates do not exist, then the current Start and Finish dates reflect the planned for start and finish dates. If Actual Start and Finish dates exist, then they replace the current Start and Finish dates. This can be confusing. Fortunately, the Task Details form displays all three sets of start and finish dates for a selected task.
If you have not considered the interaction of these schedules during tracking, I suggest spending a few minutes with the Task Details form exploring the different schedules. In the example below, Task A was baselined to start on September 20th and finish on September 22nd. However, it started on September 21st and is not yet complete. It’s expected to finish on September 24th, taking a day longer than anticipated.
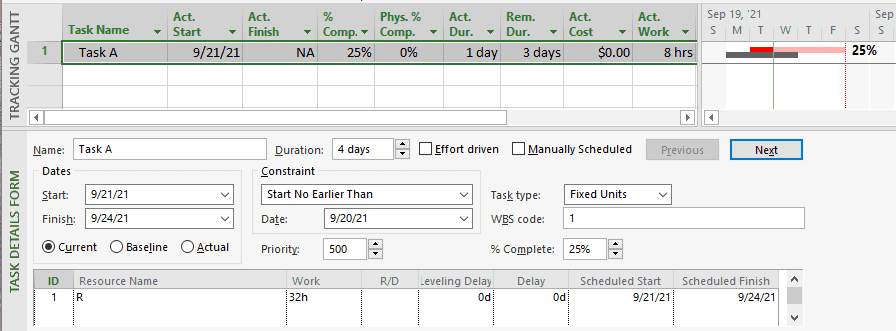
Figure 1a: Tracking Gantt Chart and Tracking table with Task Details form split view showing current schedule dates.
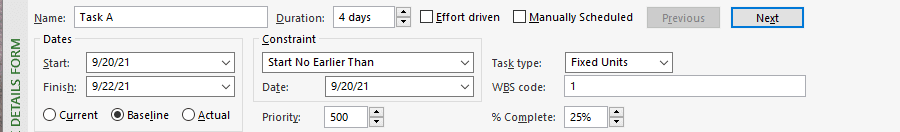
Figure 1b: Task Details form showing baseline schedule dates.
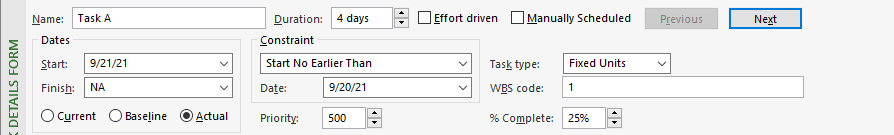
Figure 1c: Task Details form showing actual schedule dates.
Know Which Table Corresponds to Each of the Three Schedules
The current schedule is viewed with an Entry table, the baseline schedule with a Baseline table, and the actual schedule with a Tracking table.
To record Actual Start and Finish dates from your timesheet data, use a Tracking Gantt chart view. Unfortunately, the default table in that view is an Entry table. It should be a Tracking table, since the Tracking table contains Actual Start and Finish, whereas the Entry table contains the current Start and Finish dates. This leads to untold grief for novice schedulers, who modify the current schedule thinking they are recording the actual schedule. Instead, you’ll have much better success if you use a Tracking table in the Tracking Gantt chart view from the start.

Figure 2a: Use a Tracking Table with a Tracking Gantt Chart to see the Actual Schedule.

Figure 2b: Use an Entry Table to see the Current Schedule.

Figure 2c: Use a Baseline Table to see the Baseline Schedule.
The Mechanics of Tracking
The tracking process is not as trivial as marking a task complete as planned or using simple percent complete estimates. The process can vary depending upon Task Type, whether your schedule is resource and cost loaded, how many resources and of what type have been allocated to a task, and so forth. You may need to enter only one or two fields and Project will compute the rest. At other times, you may need to gather a different set of fields or enter actuals in a sequence of steps, manipulating Task Type with each step.
The details of what progress data to enter and in what circumstances are complex and beyond the scope of this article. Uyttewaal (2010) provides a thorough discussion. See Huffman (2019) and Lewis, et. al. (2019), as well. Specific sources will be referenced at the conclusion of this article.
The Tracking table has Actual Start, Finish, Duration, Work, and Cost, as well as Percent (Duration) Complete and Remaining Duration fields. You can easily modify the table by inserting or hiding fields. In the table below, Percent Work Complete, Remaining Cost, and Remaining Work fields were inserted. The Percent Physical Complete field was hidden. For this task, the Actual Start, Actual Duration, and Remaining Duration fields were updated. Project computed the remaining fields. Note that Percent Complete is 25% since the total Duration changed from three to four days after Remaining Duration was updated.

Figure 3: Modified Tracking Table.
Questions to Ask
How is progress data for your project collected? How often? How is it entered into Project? Which tracking variables do you collect? Which are computed?
Bibliography
Uyttewaal, Eric. Keeping the Schedule Up-to-date. Chapter 11 in Forecast Scheduling with Microsoft Project 2010. ProjectPro, 2010. Pp. 601-690.
Huffman, Sam. Track the Project. Chapter 8 in Microsoft Project Do’s and Don’ts: The definitive guide to jumpstart your project. MPUG, 2019.
Lewis, Cindy; Carl Chatfield and Timothy Johnson. Track Progress: Basic Techniques and Track Progress: Detailed Techniques. Chapter 8 and Chapter 14 In Microsoft Project 2019 Step by Step. Microsoft Press, 2019. Pp. 153-174 and 311-332.