
What does the demand for resources look like in my organization?
Working as a PPM consultant to support organizations from multiple sectors which have different business needs and requirements for their PPM deployments, brings lots of excitement and learning opportunities, while also being very challenging.
I have recently worked with a customer that was just getting started with Project Online, and their number one priority was to be able to easily see the consolidated portfolio of resources, which would help the senior management to identify bottlenecks on their capacity and the overallocation of resources based on their demand.
After delivering the initial set of reports which were consolidating resource capacity and demand management, I received another request: the senior management wanted to calculate the Full Time Equivalent (FTE) for resources, with the objective of knowing how many resources would be required every month throughout the year.
According to the Government Accountability Office (GAO), the FTE represents “the total number of regular straight-time hours (i.e., not including overtime or holiday hours) worked by employees divided by the number of compensable hours applicable to the fiscal year”. The text also determines that, for the purposes of estimating FTEs, 2,080 hours would be equal to one FTE (40 hours x 52 weeks).
The customer I was working with wanted to bring the calculation down to the lowest level, as we know that not every week throughout the year will have 5 business days (because of the federal holidays that will reduce the number of working hours) and not every month will be composed of 4 full weeks of work (because the number of working days within a month will vary based on the calendar). So they wanted to calculate the exact number of working days for each single month to be able to discover the number of needed FTEs each month.
In addition to this requirement, my customer wasn’t using Resource Engagements, so all the calculation would be created considering assignments only.
The data model
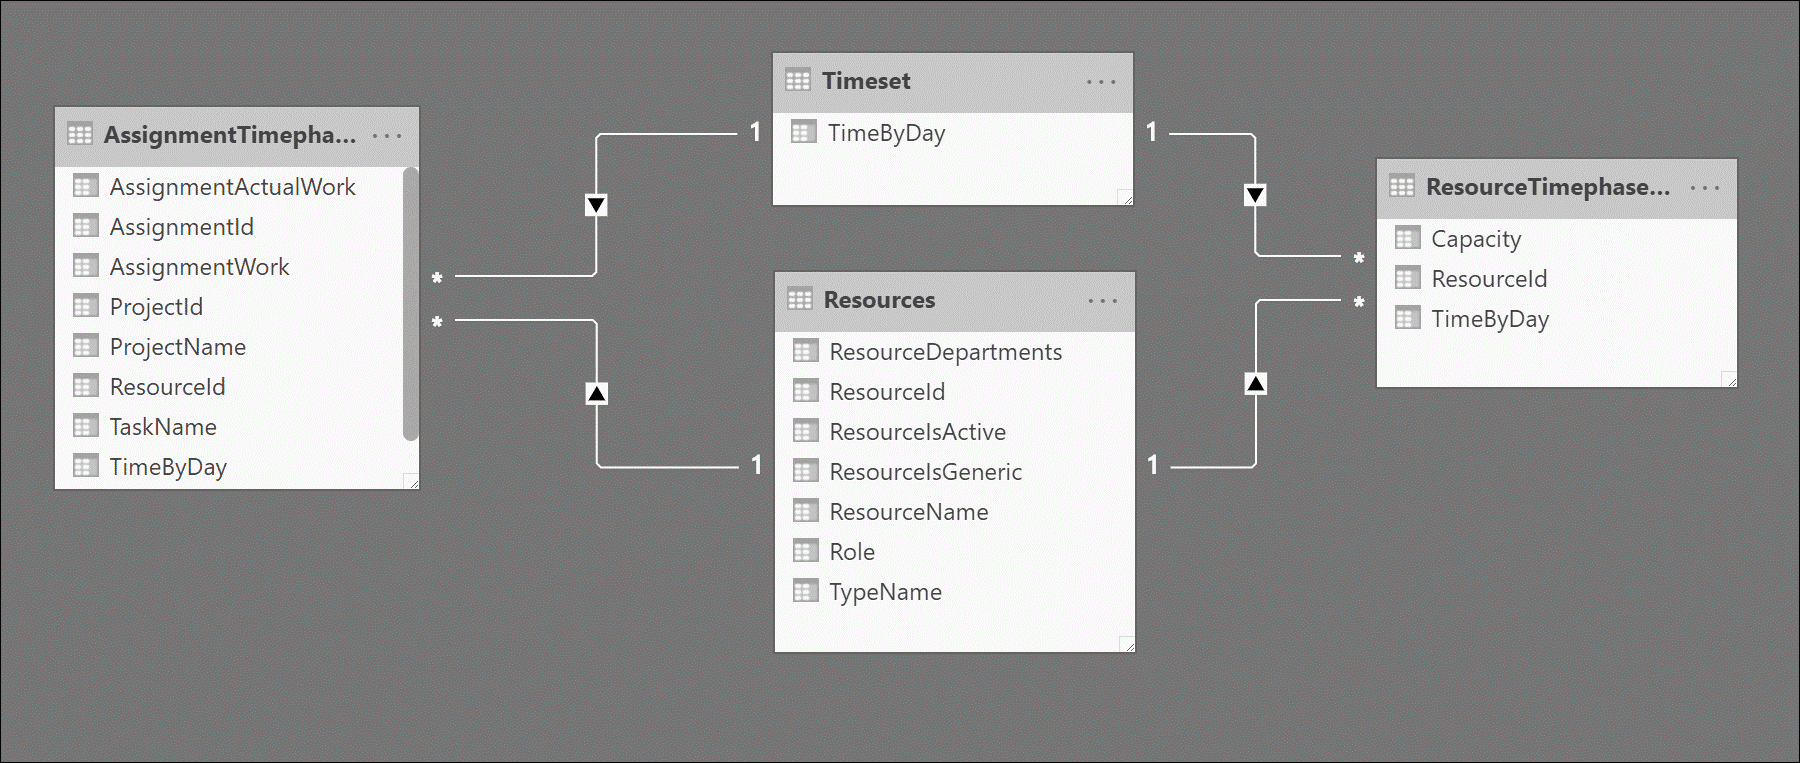
The data model used in the report is shown below. Note that the ResourceTimephased dataset wouldn’t be required to calculate the FTE, since the calculation needs to use only assignments data and does not require the utilization of capacity. However, it was included in the report because my customer also wanted to compare capacity vs. demand and wanted to discover the remaining availability.
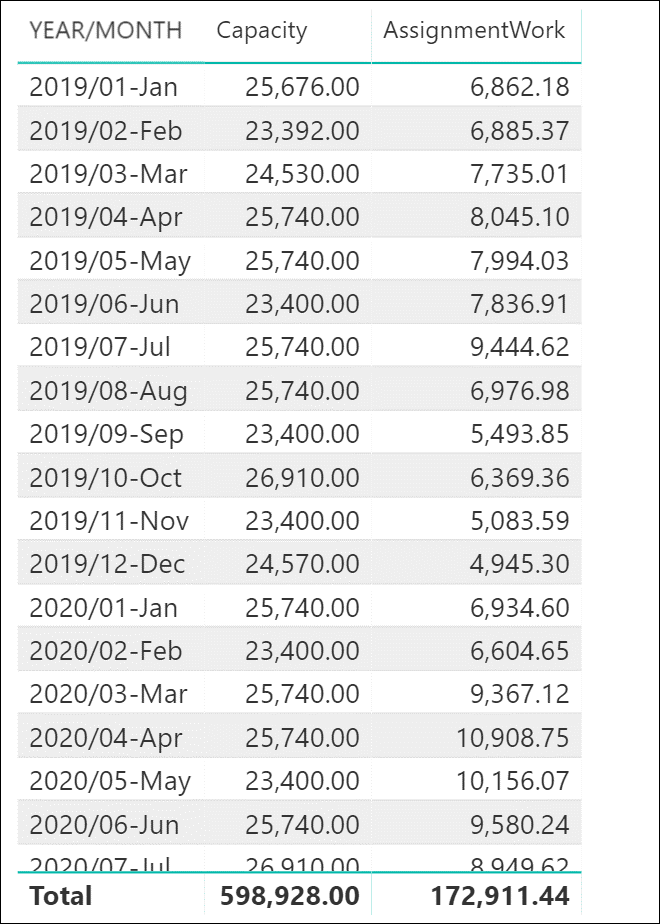
Once the data was retrieved and all the relations were created, we could put together a simple report to compare capacity vs. assignments over time:
FTE calculation
If a very simplistic criteria could be used to calculate the FTE, we could create a formula that would take the total number of hours assigned to resources and divide its value by 168 (with 168 being the average number of hours an employee works a month: 8 hours per day * 21 days a month). The result would look like this:
As I am using Power BI to mock this report up, the DAX expression used to calculate the FTE is:
FTE = [AssignmentWork]/168
However, as per my initial considerations, we need to bring the calculation down to the lowest level, taking into consideration the exact number of working days each month to be able to determine the correct number of FTEs required each month.
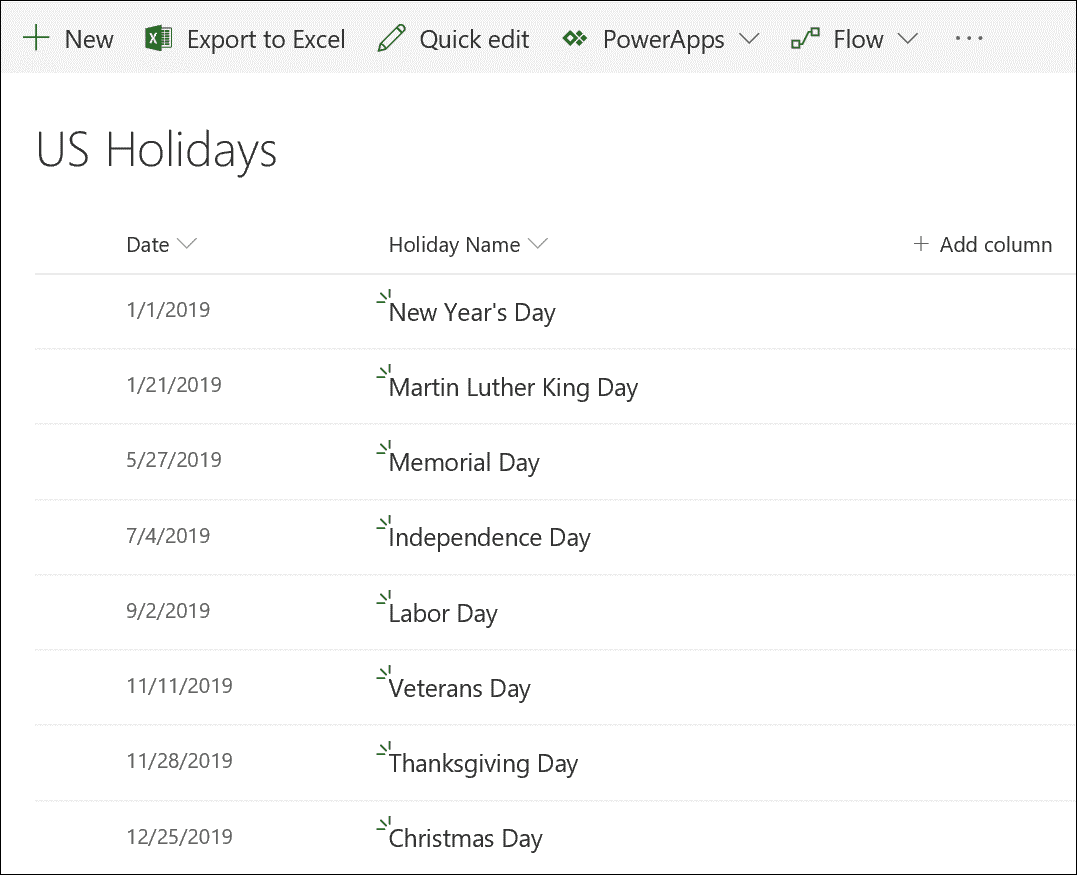
The initial step is to add to the data model a new table that determines the federal holidays for the year, so we can use this table to subtract the number of working days in a month that has a holiday. To keep it simple, we can create a new SharePoint list and enter all the holidays for 2019:
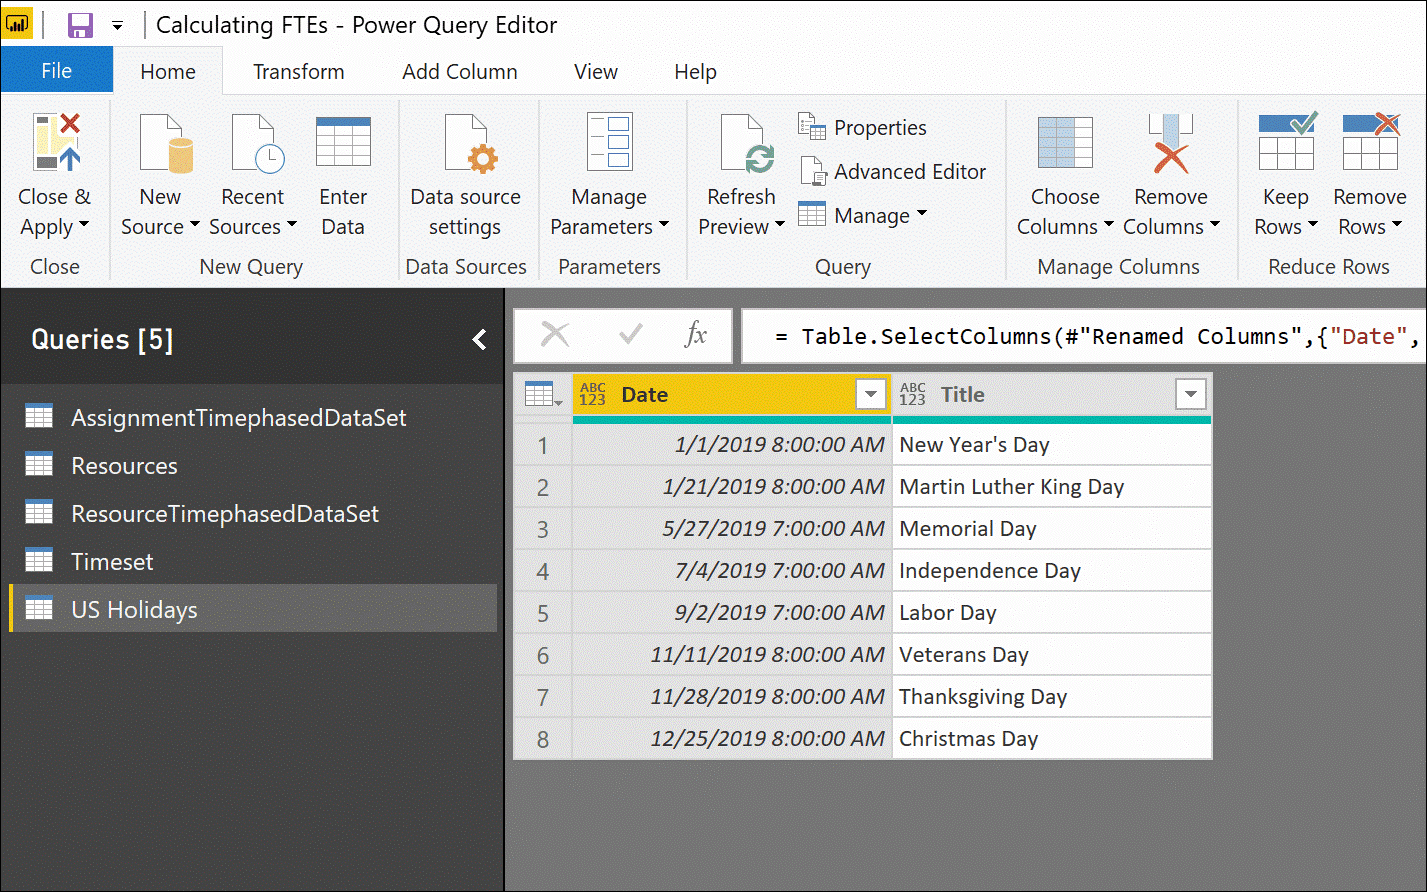
Once the SharePoint list is created, we need to add it to the data model in Power BI. An important thing to note is that the Date column is formatted using the default ‘datetime’ format, which brings us inconsistent results such as 1/1/2019 8:00:00 AM and 5/27/2019 7:00:00 AM:
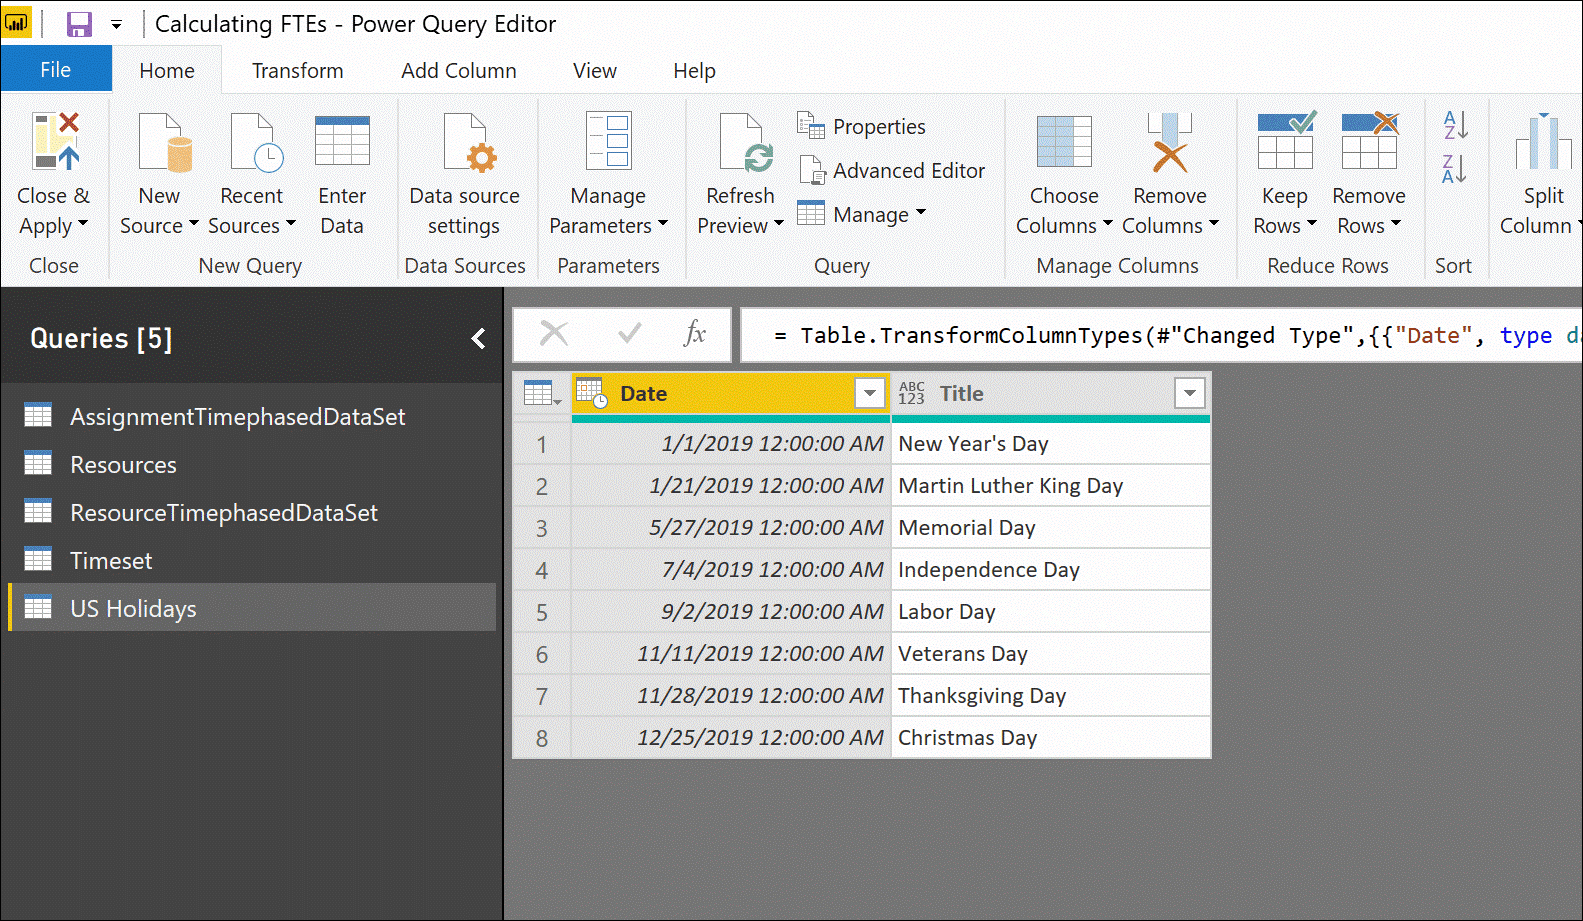
As we will need to establish a relationship between the Date column from the US Holidays table with the TimeByDay column from the Timeset table, the column values on both tables need to be the same. The TimeByDay column uses the default ‘datetime’ format, always displaying the 12:00:00 AM suffix in conjunction with the date. Because of this, we need to transform the Date column in the US Holidays table to be formatted the same way, so we will be able to create the relationship. To do that, we can use the ‘Transform’ option in Power BI’s Power Query Editor. As a result, the Date column in the US Holidays table will look like this:
Once the transformation is finished and the relationship between the tables US Holidays and Timeset is created, we will be able to build a more advanced set of formulas to calculate the FTE.
Calculating the FTE based upon the number of working days
To be able to calculate the exact number of FTEs as needed in this exercise, the first thing to do is to discover the number of working days in each month. To facilitate the understanding of the logic used to achieve this goal, I will create two new columns in my data model, under the Timeset table:
- The first column will be called ‘Is Working Day’, and will check if a date is a Sunday, a Saturday or a regular working day
- The second column will be called ‘Is Holiday’, and will check if a date is listed as a holiday in the US Holidays table
The DAX expressions used to create the two columns are listed below:
Is Working Day = IF(OR(WEEKDAY(Timeset[TimeByDay])=1,WEEKDAY(Timeset[TimeByDay])=7),”No”,”Yes”)
Is Holiday = IF(RELATED(‘US Holidays'[Title])=””,”No”,”Yes”)
Once the DAX expressions are created, we can build a third column in the data model that will calculate the number of working days using the two previous columns:
Working Days = CALCULATE(COUNTA(Timeset[TimeByDay]), Timeset[Is Holiday]=”No”,Timeset[Is Working Day]=”Yes”)
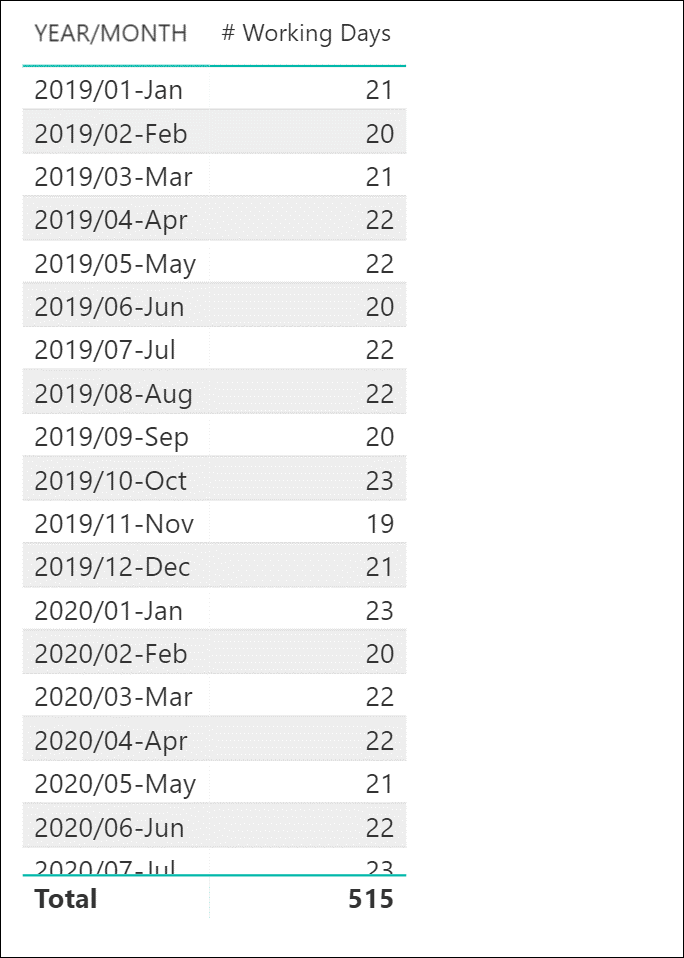
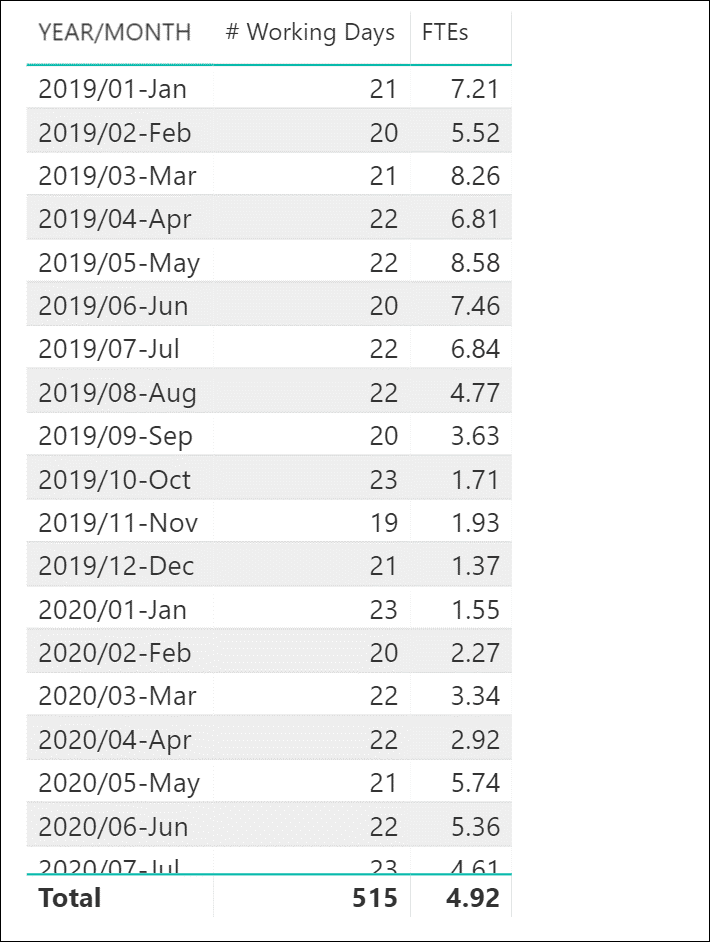
As a result, we can now count the exact number of working days in each month (please be aware that the holidays for 2020 were not included in the SharePoint list):
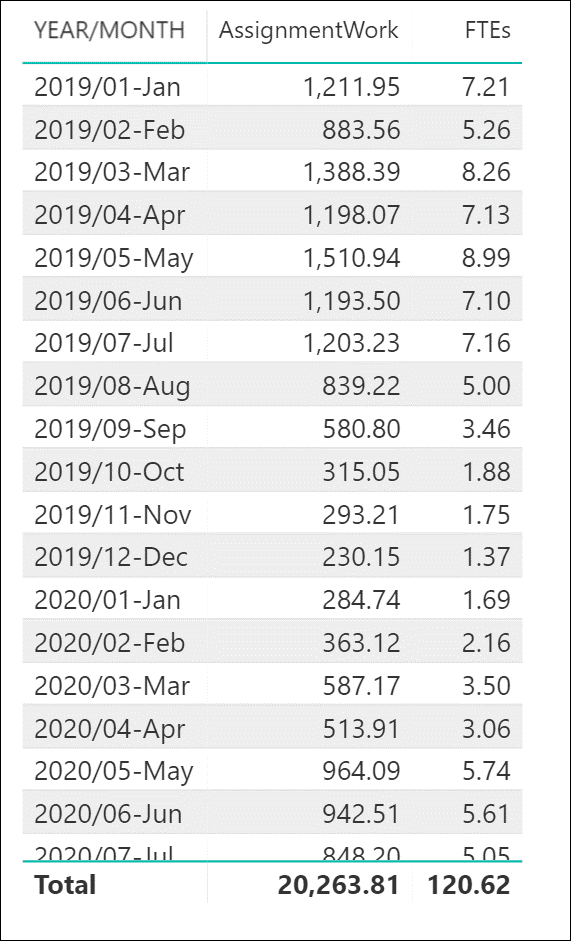
Based on that, we can change the FTE formula to not use 168 as a fixed number that represents the average number of hours worked per month by an employee; instead, we can multiple the number of working days by 8 to discover the number of working hours by employee each month, and then use this value in conjunction with the total number of assigned hours. It is also important to mention that, if your organization does not consider 8 as the total number of hours a resource can dedicate to projects each day, you can replace this number by whatever is your standard number of daily hours dedicated to projects. The results in my scenario will look like this:
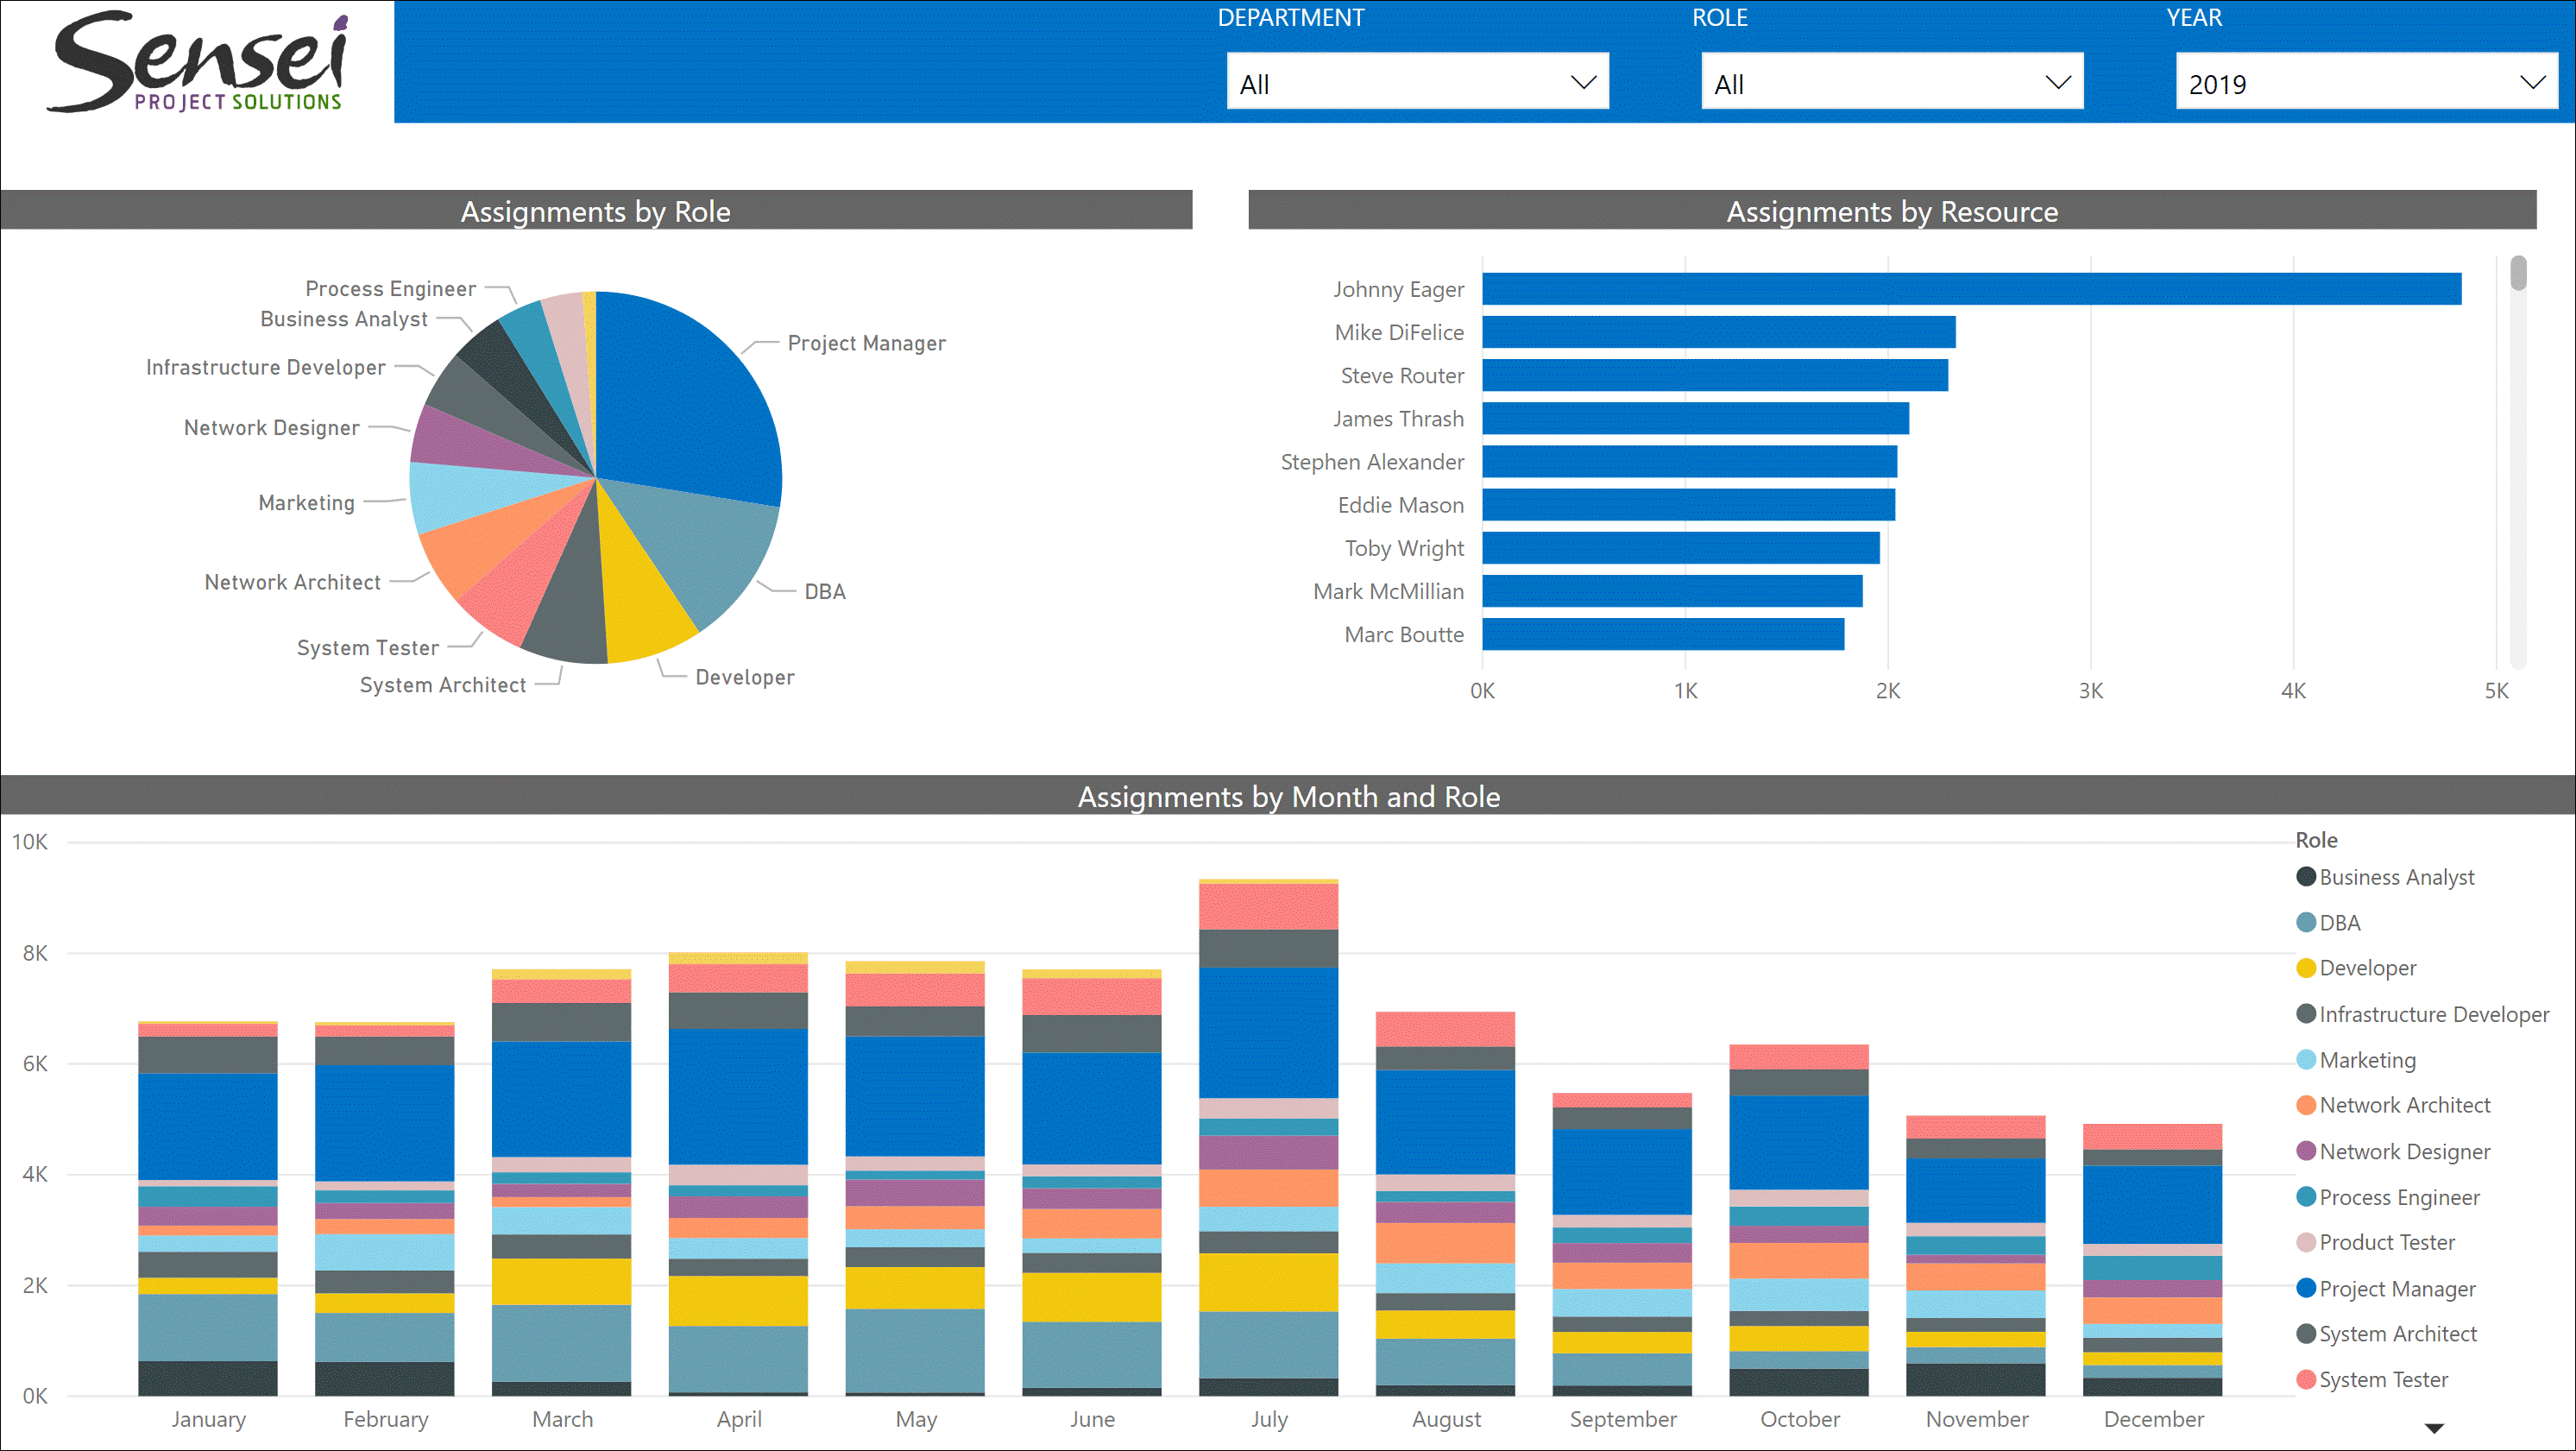
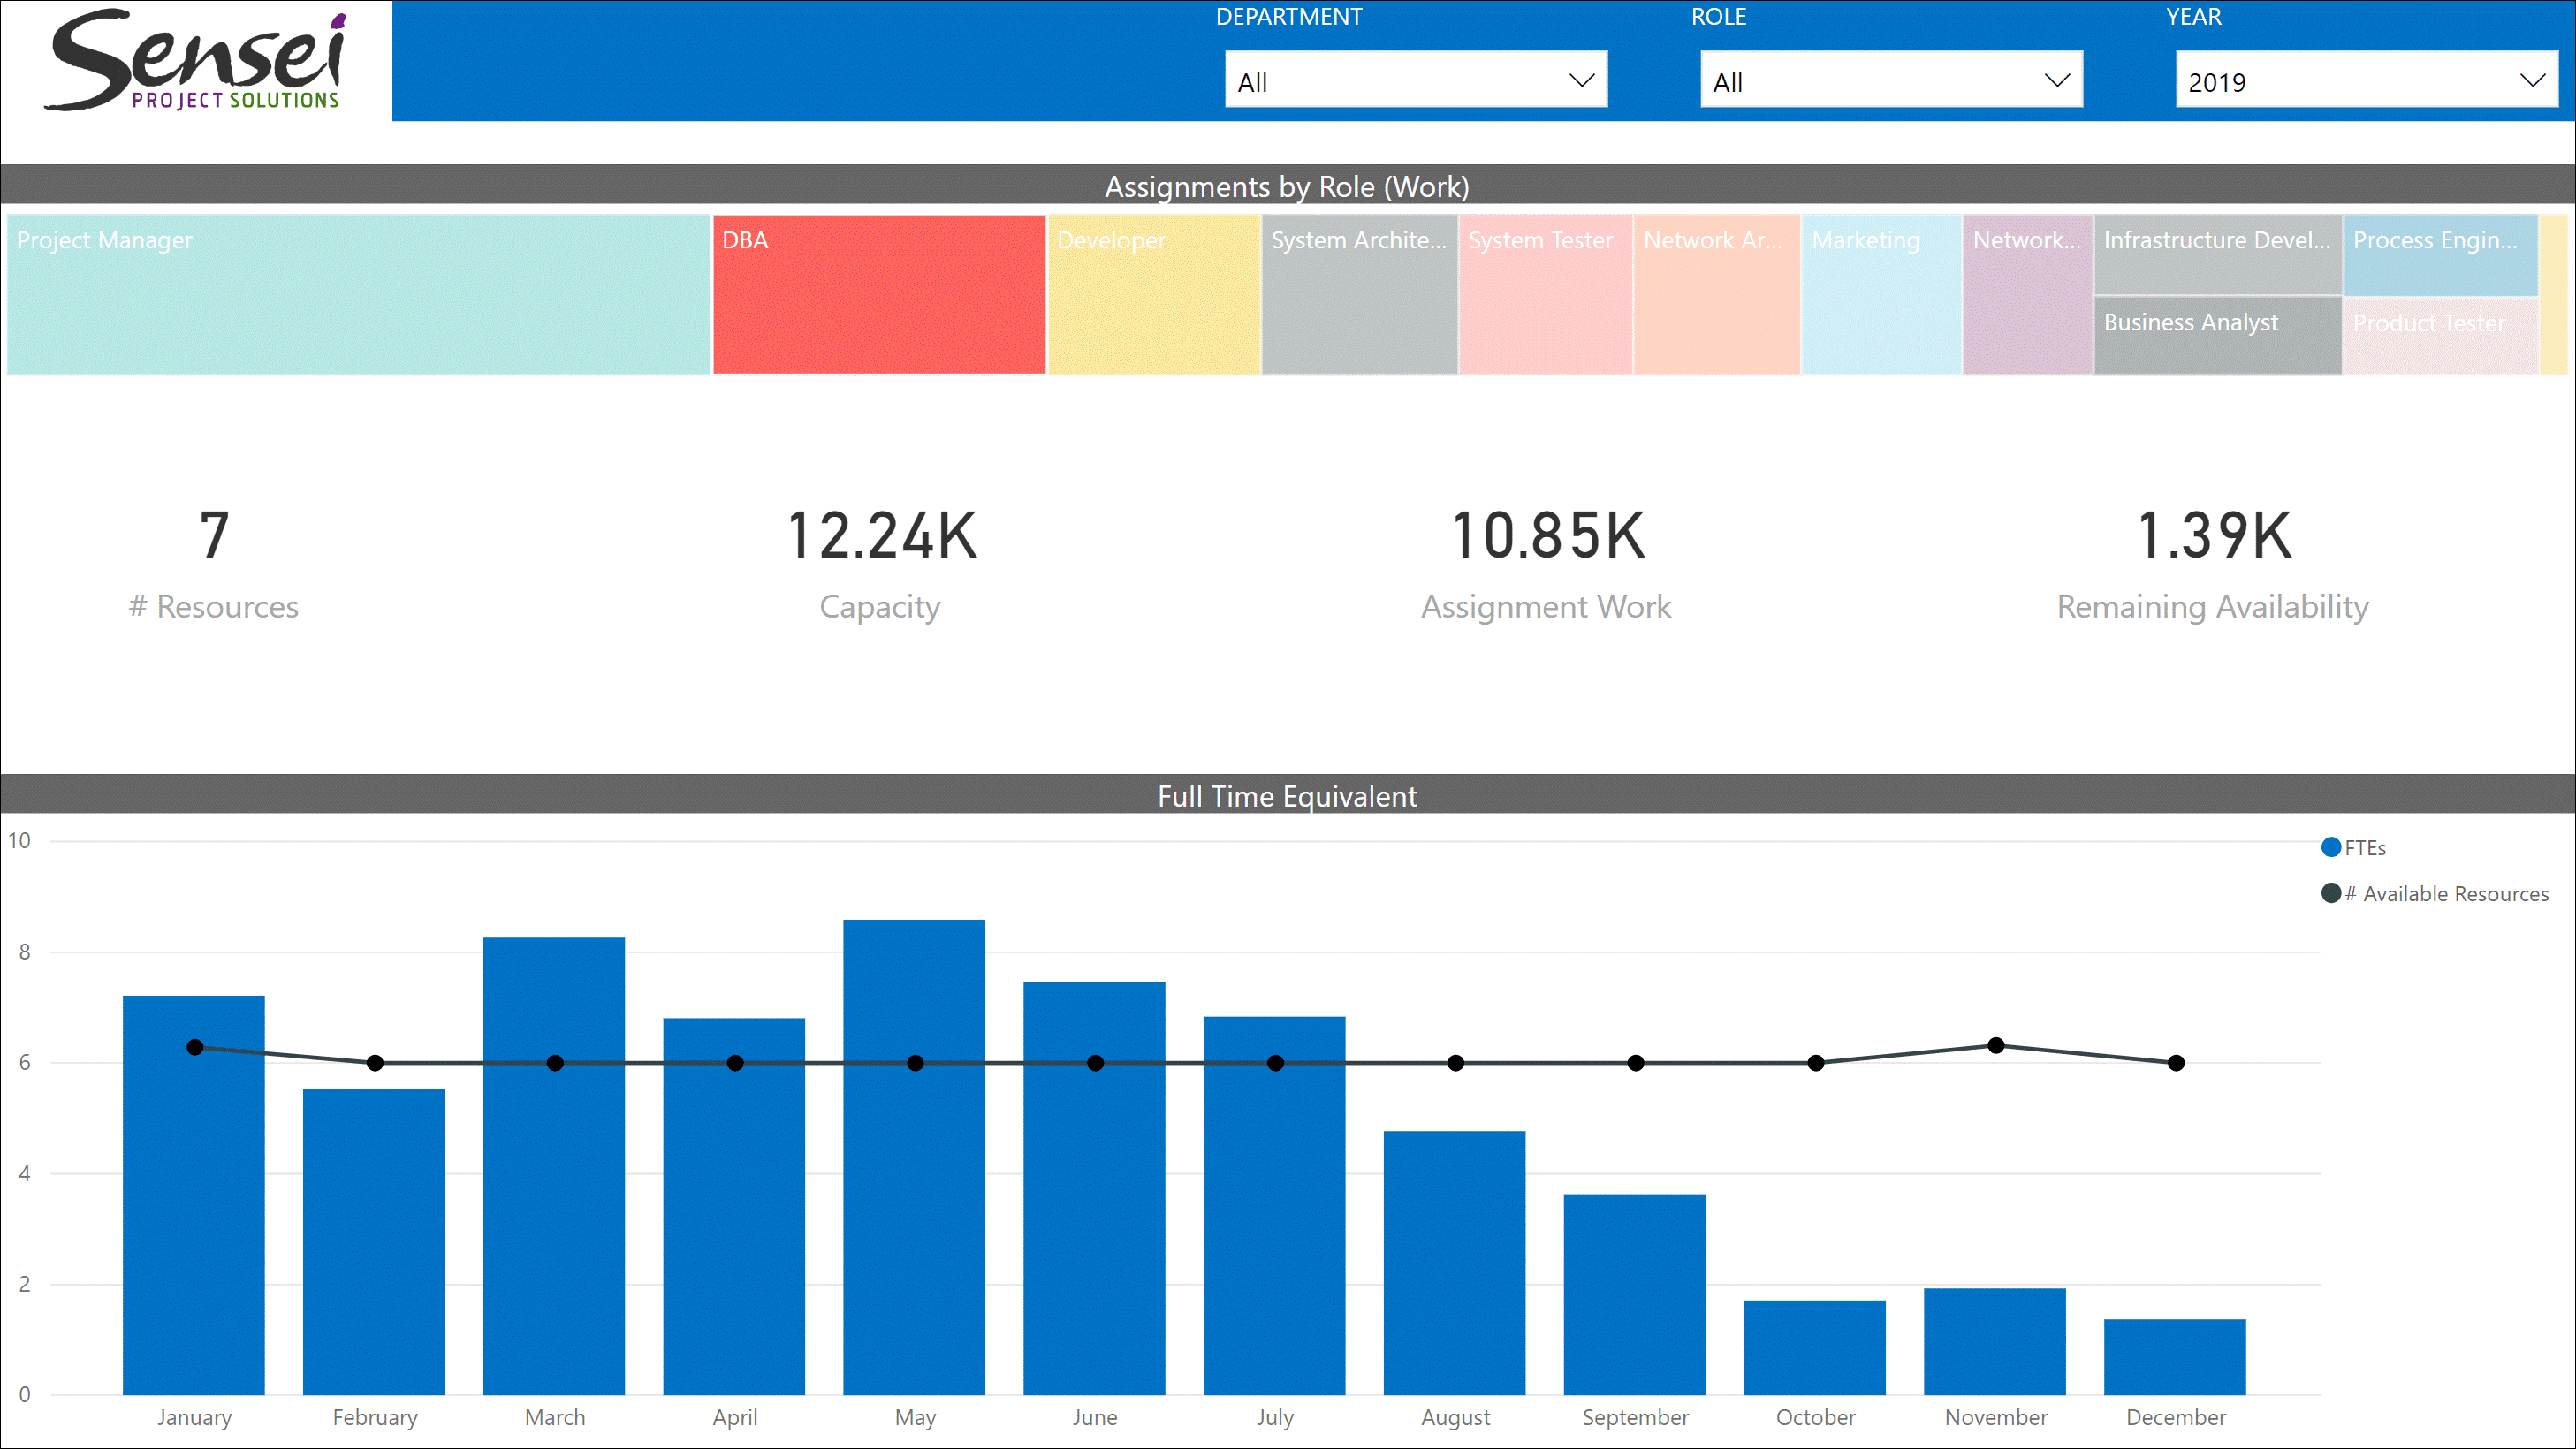
To make things look more professional, there’s nothing better than building a very nice dashboard:
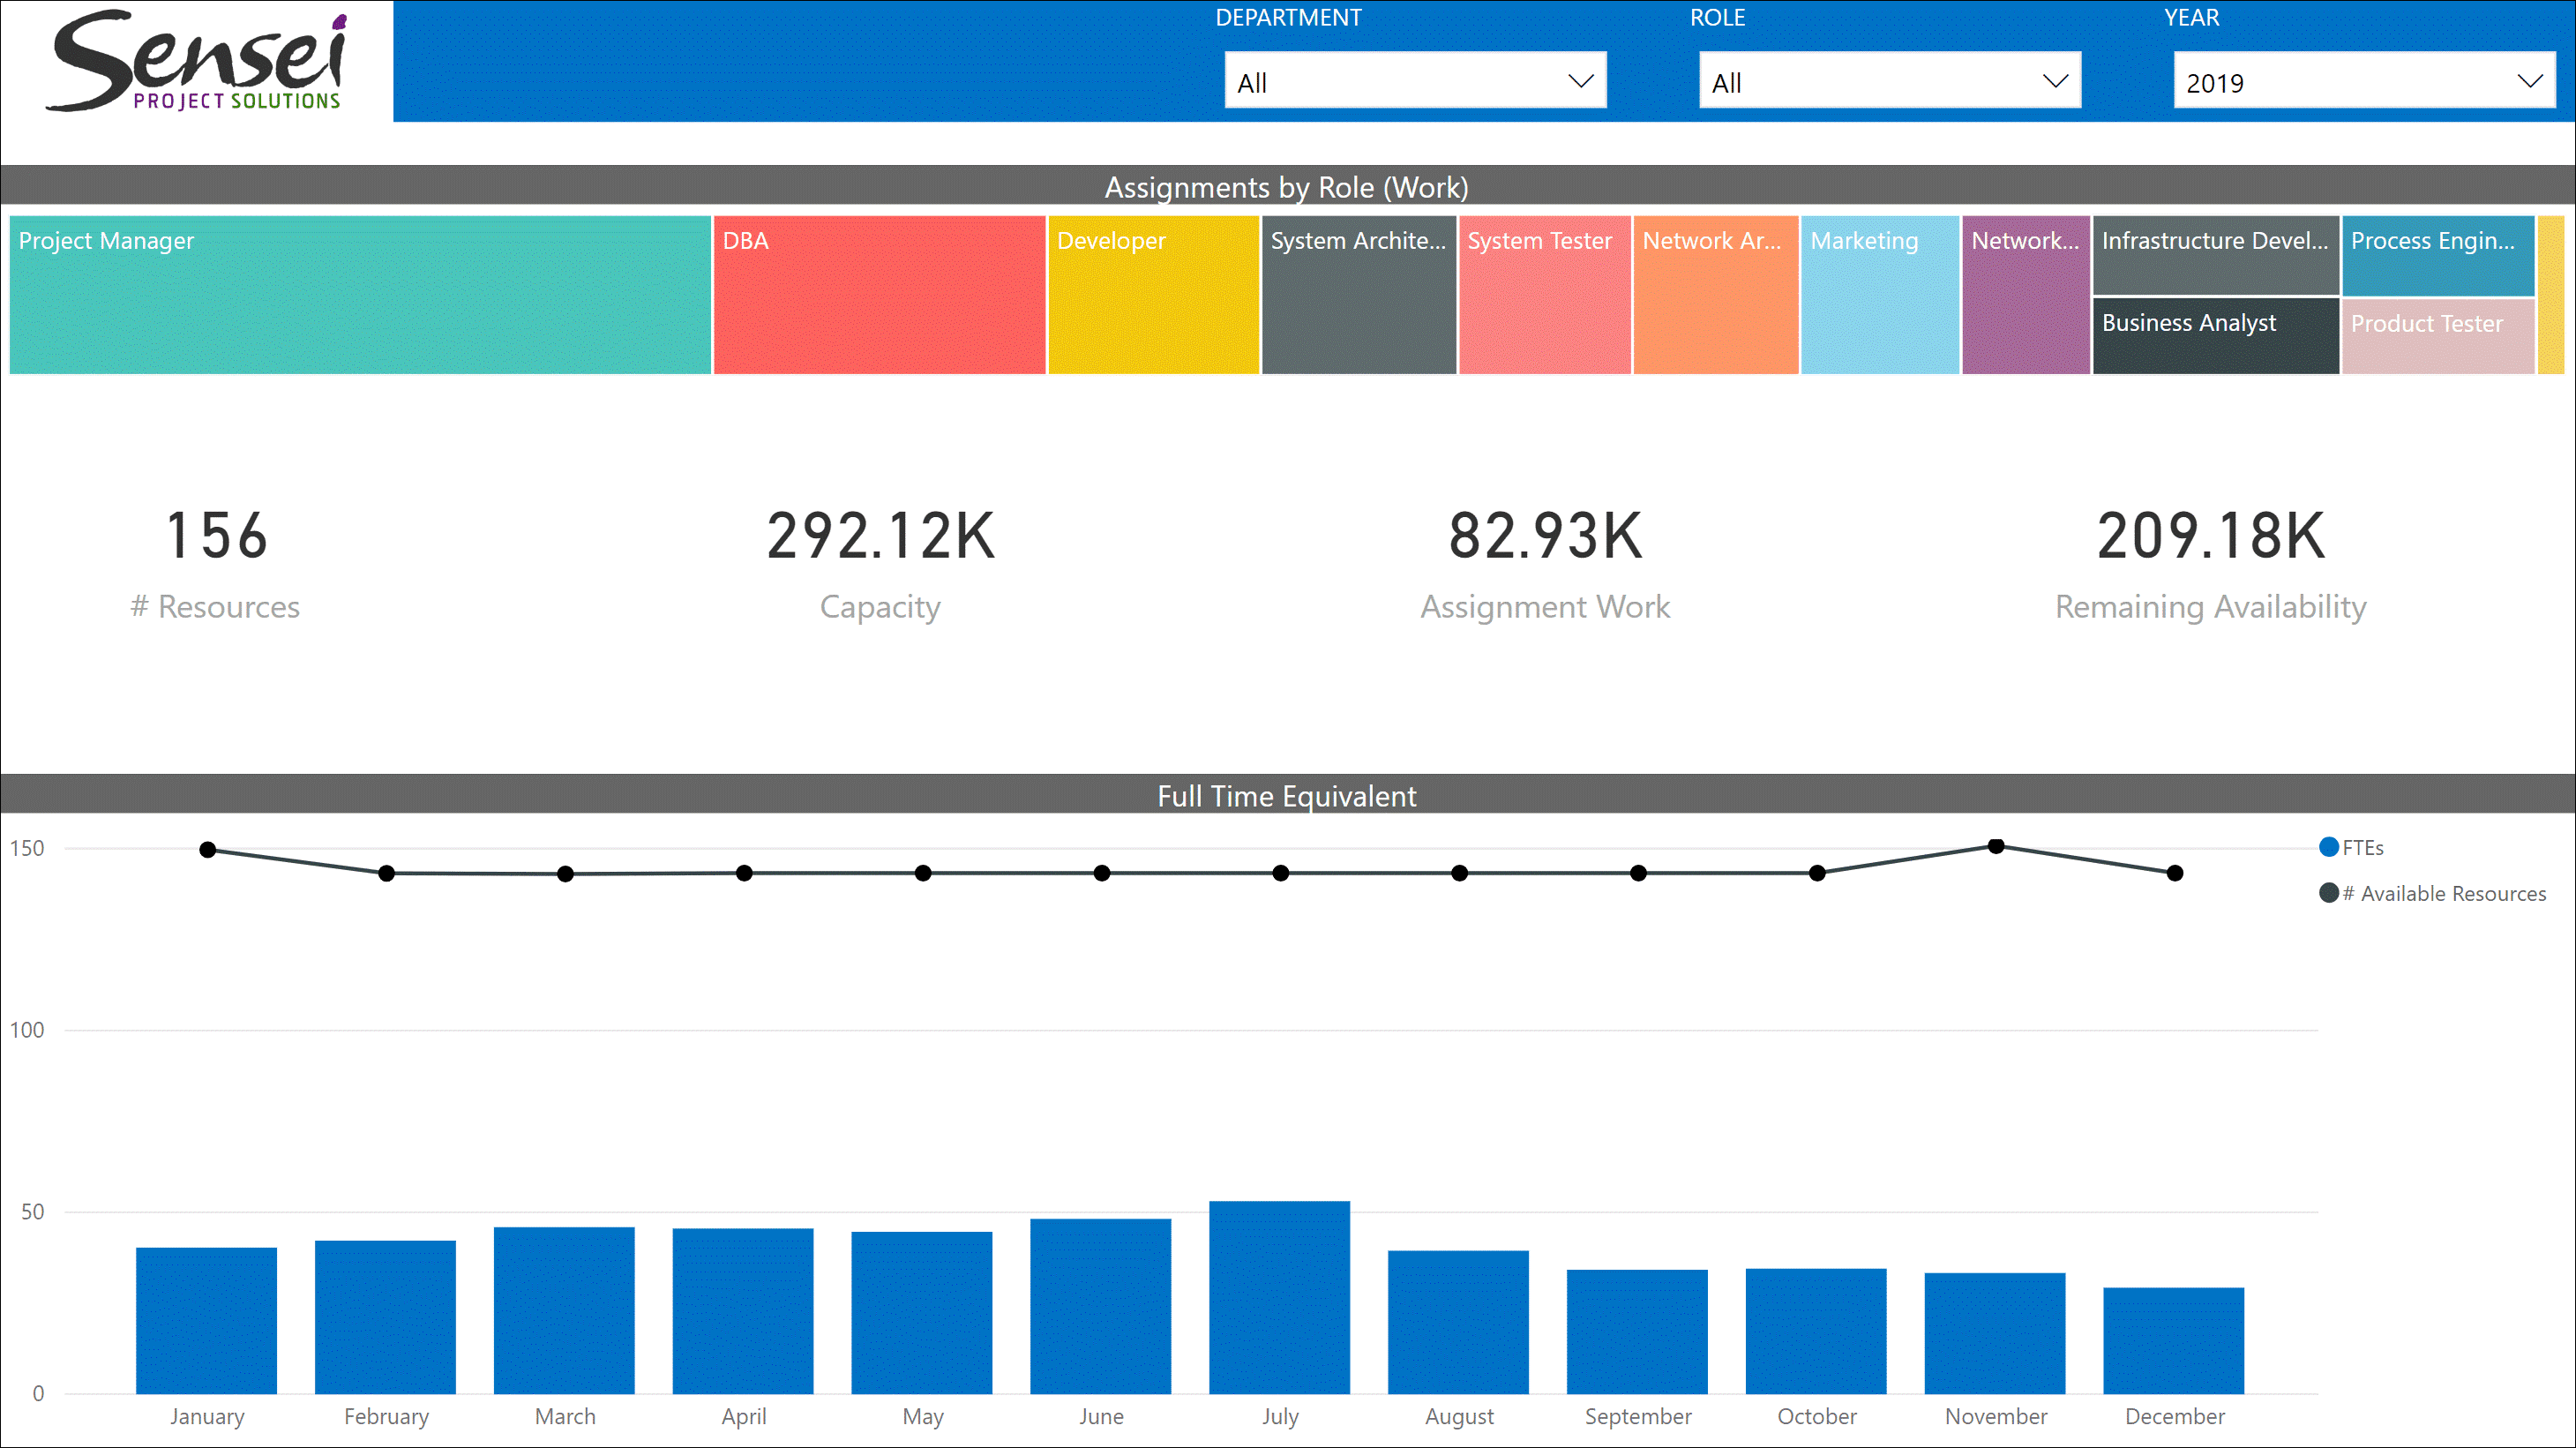
As we are using Power BI, all visuals are responsive, allowing the senior management to focus on what’s relevant to them:
Originally published here. Used with permission.


Raphael Santos
Hi Wade –
I think the overall steps won’t change, in a sense that you’ll still have to use the AssignmentWork column from the AssignmentTimephased table. The difference will be that you’ll have to filter your report to be only applied to the context of the project(s) you want to display
I hope this helps.