
Turning the whole system into something greater than the sum of its parts
A crucial part of Project Portfolio Management (PPM) is the selection of projects. This is an ongoing dynamic process. In the following two part article, I will be demonstrating Net Present Value or NPV. PPM is simply managing your company’s resources. It has less to do with project management skills and more to do with strategic planning. In selecting projects, you want to pick the ones that create the greatest return and contribution to the strategic interests of your organization within the confines of your annual budget. Going a step beyond, you really want to optimize the portfolio and turn the whole system into something greater than the sum of its parts.
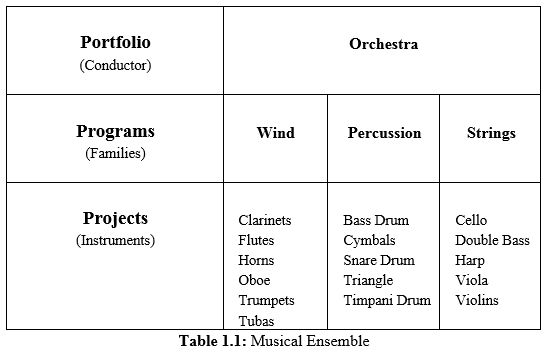
Think of it this way – if each project is an instrument in your company’s orchestra, then you have programs made up of wind, percussion, and string instruments. You want someone – the conductor – to enhance the whole system by having the technical skills, leadership skills, and respectability to lead the orchestra in creating beautiful music. See Table 1.1.
In many ways, PMs and musical conductors have common denominators. For example:
- They have the capacity and desire to lead/guide their project teams or musical ensembles. This includes cooperation and networking.
- They have to be good communicators. Besides verbal communication with their orchestras, conductors also communicate through hand gestures, typically with the aid of a baton, which means they need to be in good physical shape! So should PMs for that matter.
- They are involved in bringing talent together and scheduling activities.
- They have to interpret the overall project plan or musical scores.
- They have a rehearsal process. That is, to review work-in-process plans or practice musical scores. Practice makes perfect!
- They have to satisfy their customers. Whether users/stakeholders or audiences, hopefully the customers are happy people!
Projects, Programs, and Portfolio Differences
Throughout my career working with many users and executives, I have learned there is a lot of talk about projects and portfolios, but not much reference to programs. Many times I have been assigned a “project,” analyzed the endeavor, and realized that in actuality it was a group of three to five related projects. When I gave status updates, I always used the term “program,” although quite frequently the users and/or executives would call my endeavor a “project.” It always bothered me. What I got from this was that they really didn’t know the difference between a project and a program, or they did, they just didn’t care about the semantics (the whole “just get the darn job done!” mentality). Before I get into project portfolio selection, it’s important that we cover the differences between projects, programs, and portfolios.
Portfolio managers (PfM) balance conflicting demands between programs and projects and manage them to achieve the anticipated benefits. Program management (PgM) focuses on achieving the cost, schedule, and performance objectives of the projects within the program or portfolio, while project management (PM) is largely concerned with achieving specific deliverables that support specific organizational objectives.
The Standard for Portfolio Management – Third Edition (Project Management Institute, 2013c) documents the attributes, differences, and coincidences among the three (3) types of practices as follows (Table 1.2):


Prioritized Project Portfolio
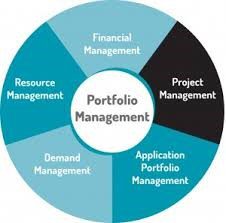
Everyone would like to have a prioritized project portfolio that holds maximum value over a specific time period, but there are many variables (i.e. having enough money and sufficient resources with the right skills) to be considered. The key goals of the portfolio optimization process are to align project work with the strategic direction of the organization, maximize the value of the portfolio, and to balance the project portfolio.
The following NPV financial case studies will hopefully provide us with the insight we need to improve a portfolio from a solid one to a much more profitable one. NPV is one of the most widely used financial attributes because it measures the financial return of an investment, which uses external factors like inflation, investment risk, and cost of borrowing money.
Case 1: Maximizing NPV
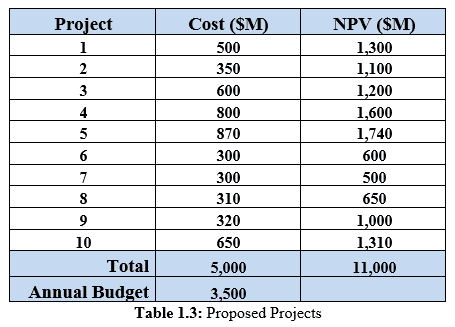
Let’s say the Fit-It company has a portfolio of ten new proposed projects (see Table 1.3) that require a total cost of $5 billion and could yield $11 billion for NPV. Regrettably, the company is constrained by its annual budget of $3.5 billion and needs to determine which projects to fund to maximize its potential. The first step is to rank or sort the NPV column (see Table 1.4) to find out how far we can go down the list until we run out of budget. We can afford five projects (5, 4, 10, 1, and 3) for a budget of $3.420 billion yielding a portfolio NPV of $7.150 billion.

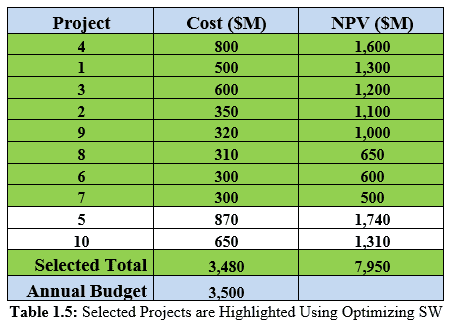
Case 2: Optimizing NPV
The previously described case study is certainly feasible as far as portfolios go, but it may not be optimal. In fact, we may be able to create a better portfolio getting supreme value from the company’s annual budget of $3.5 billion. Using optimization software (developed in-house or purchased), we search for the most efficient portfolio. Optimizing software uses many variables, such as risk, budget, people, current ongoing projects, and manufacturing capacity, to arrive at the best combination of projects. Table 1.5 is an example of using optimizing software (SW). The NPV from Case 1 went from $7.150 billion to currently $7.950 billion for an increased value of $800 million. The new budget of $3.480 billion almost matches the annual budget and the number of selected projects went from five to eight.
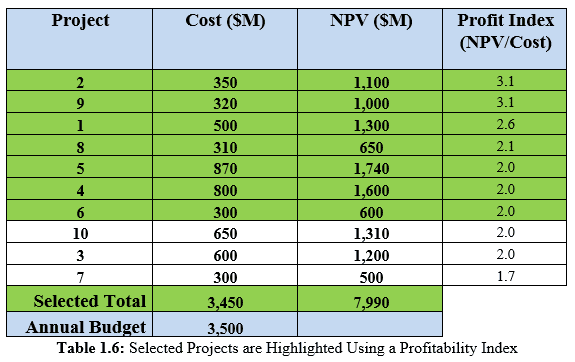
Case 3: Profitability NPV
Since some executives prefer to see an annual return per project, they could look at the profitability index (i.e. Return on Investment), which is the NPV divided by the initial investment or cost to get the best combination of projects. This ratio basically gives you the biggest bang for your buck for each project. Of course, the higher the profitability index the better! I have taken the same ten proposed projects used in the previous case and ranked them by their profitability index (see Table 1.6) to get a higher NPV ($7.990 billion) than the one from the previous case described ($7.950). Also, the budget from the previous case went from $3.480 billion down to $3.450 billion, which means we saved $30 million in costs, and at the same time, increased our NPV by $40 million for a $70 million positive spread.
We will pick up next time (in part 2 of my article) by considering how the financial formulas available in MS Excel and Project fit into this analysis. I will also cover several other considerations that should be made when selecting projects for portfolio management. In the meantime, what tools do you use to make project portfolio selections?

Martin Smit
Thank you sharing Ronald, looking forward to Part 2. Regards. Martin Smit (PhD, PMP, Pr. CPM)
Robin Nicklas
Thank you for the article! Portfolio selection techniques are an important component of a PM’s toolkit.
While the optimized solution in table 1.5 can be obtained using the Simplex method in the MS Excel Solver add-in, the Evolutionary method yields a better solution. Projects (1, 2, 4, 5, 9, 10) are selected. NPV is maximized at $8.050B with a total spend of $3.490B. For this example, the result is the same as attempting to maximize total spending within the stated budget limit.
The Profit Index values in table 1.6 are rounded. If the precision is expanded, project 10 is slightly more profitable than projects 3, 4, 5 and 6. How the ties in ranking are broken can affect the result.
If the Profit Index is maximized, projects (1, 2, 3, 6, 7, 8, 9, 10) are selected, with total NPV of $7.660B and cost of $3.330B. This is not as good a solution as the one shown in table 1.6.
This poses an interesting problem for the decision maker. Which solution is better: the one with maximized NPV, but lower profitability; or, the one with maximized profitability, but lower NPV? If this might keep you up at night, consider what happens when you add other variables to the mix, such as strategic fit or risk.