With Microsoft Project Server 2007 and 2010 you can easily create reports on the actual state of your program. But when senior management asks, “What are the changes since our last meeting?” typically, you’ll have to look at the last report, find these changes, and create a new report. In other words, you have to duplicate tedious effort every time that reporting cycle rolls around.
In this article I describe a simple process for stopping that hamster wheel of duplication and preparing a nice PowerPoint presentation for senior management that can be updated dynamically for every reporting period. The technique relies on the use of SQL Server Reporting Services, Excel, and PowerPoint
I’ve broken this project into the following steps:
1. Define your reporting needs.
2. Create a PowerPoint template with placeholders for data.
3. Build a report with Excel Services to collect the required data periodically.
4. Compare two consecutive reports in Excel and generate the output to PowerPoint.
So that you’ll know what the final results will look like, I’ve provided a sample report that you can use to model your own after.
Define Your Reporting Needs
The common questions I frequently hear from management are these:
- What’s happened in the program since your last report?
- What are the key issues?
- What will be delivered in the coming period?
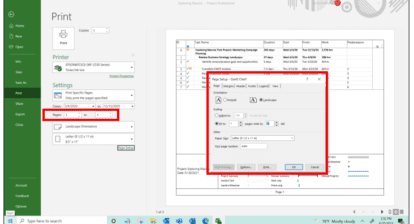
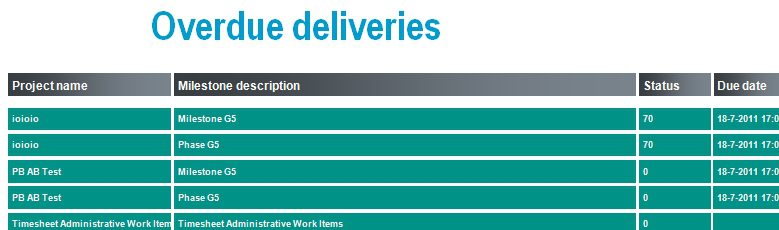
My practice is to prepare a standing slide deck that addresses each of those areas. For example, my response to that first question is presented in Figure 1. In the same slide deck I also present the forecast for the next six weeks as presented in Figure 2, the actual status of the program as shown in Figure 3, and the overdue deliverables as shown in Figure 4.
Figure 1: The planning changes report
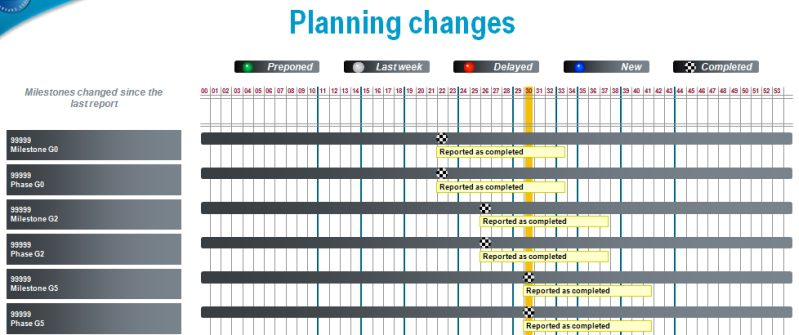
Figure 2: The planned delivery forecast report
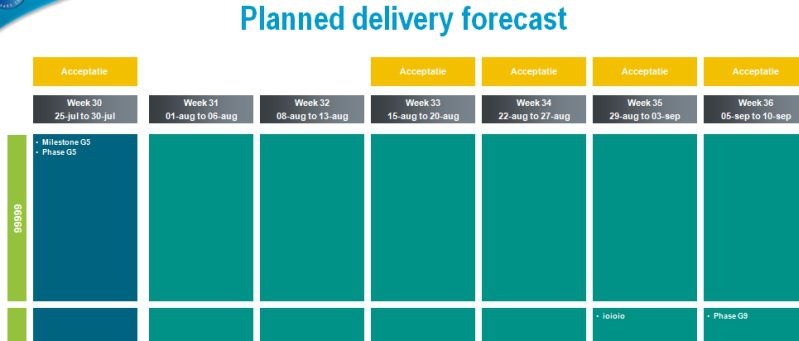
Figure 3: The program consolidated status report
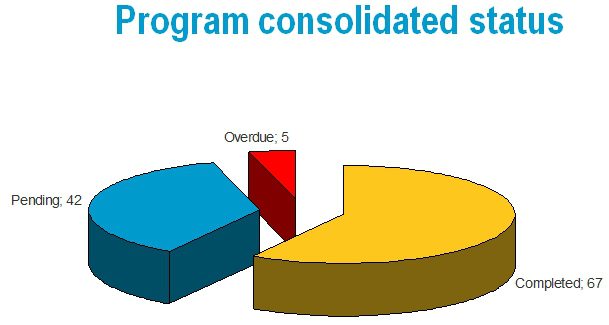
Figure 4: The overdue deliverables report
Use your experience and imagination to create the full set of slides for your specific audience.
Create a PowerPoint Template
Once you’ve defined the reporting needs that you’ll want to adjust for each reporting period, you can design a template for presentation. Usually the presentation consists of some general explanation slides and a section for each type of report. Create the layout of these slides and insert Alternative Text as the placeholder for the data to be imported.
Build a Report with Excel Services
The information from your report should be extracted from Project Server using SQL Server Reporting Services. You’ll have to verify that all required information is stored in Project Server. Eventually, you may need to add additional custom fields to fill gaps. Usually the report can be based on views of the Project Server Reporting Database. Export the report to Excel and keep at least the last two versions of your report for use in the next step. I would recommend creating a subscription on the report and saving the versions in the program workspace in SharePoint.
Compare Two Consecutive Reports in Excel and Generate the Output to PowerPoint
Doing the final step of the project requires creating a macro using Visual Basic for Applications (VBA) in Excel and pulling in PowerPoint to complete the operation. To create the macro, follow these steps:
1. Prompt the user to import two consecutive reports (Excel files). Here’s an excerpt from my macro:
# Ask user to select previous planning sheet
PreviousReport = Application.GetOpenFilename(“Excel Files (*.xls),*.cls”, 1, “Import Previous Planning”, “Import”, False)
If CStr(FileName) = “False” Then Exit Sub
2. Compare the reports to collect the data for your presentation.
Compare Previous and Current Planning for each line to get the following data:
- New Line
- Line Changed
- Line Completed
- Planning changed by ___ weeks
3. Open the PowerPoint template and insert the data into the placeholders.
The PowerPoint template for Planning Changes has placeholder lines for all possible states. Delete the ones that aren’t applicable, position the dot on the right place, and insert the right text in the placeholder.
4. Remove the empty slides and lines.
Through use I have found it easier to remove empty slides and lines than to add them when needed. Therefore my template contains more slides and lines than the actual report will have.
5. Save the presentation.
Running the Report
Each time you need to report to management on program status, open Excel and run the macro. The macro will request that you specify the two Excel report versions you want to compare. After some number crunching it will inform you that the presentation is saved.
This document presents the basic steps for generating a professional program presentation for senior management. Based on these concepts, you can build similar solutions for other stakeholders. Once you’ve tweaked it for their specific needs, you can simply run the macro each time they want to know: What’s happened to the program since the last time we looked?