
Like Sprint or Release Burndown charts in Scrum, cumulative flow diagrams (CFDs) are frequently used in projects using a Kanban framework. This is because one of the fundamental aspects of Kanban is this: Manage the flow. With a cumulative flow diagram, we can manage the flow of work.
Imagine an Agile development team is delivering a number of features on-demand. The team is following a Kanban mode with Testing being a workflow state. If the team has many features developed but is waiting to test, then the development band/state in the Kanban board will be narrow, and the testing band will be wide. A cumulative flow diagram assists.
The Cumulative Flow Diagram Basics
A Kanban cumulative flow diagram shows work in progress in the Kanban board. As the name indicates, it is a flow diagram and is cumulatively represented. It gives insight into how many items are completed, how many items are remaining, and where the bottlenecks are in the process flow.
In the CFD below, I’ve taken the cumulative diagram for the number of issues coming to the development team on a weekly basis. There are three workflow states: “TODO,” “DOING,” and “DONE.”

Let’s interpret the diagram. Obviously the TODO items are getting added up at a faster rate, whereas the DOING and DONE are not able to catch up. TODO items in the graph are getting widening, and just below that, the DOING flow state is shown as narrower. This means that the bottleneck is in the DOING flow state. Also, the team is not able to move the DONE items well, either. From a technical standpoint, it may suggest that the items taken on may need to be broken up, or it may be possible that the team is unable to deliver on the issues taken up.
Our Project Scenario
Our project is that of house renovation work, which is being done within the Kanban framework. There are a number of work items to be completed in the backlog, some in progress, and some done, as shown below in the Gantt Chart view.

We have planned for the capacity available for the team; however, some of the items are not planned at all. This can also be seen in the Task Board view (or the Backlog Board) view by going to View tab > Task Views > Task Board > Task Board command.

As shown in the above figure:
- A couple of work items are in “Done” and “In Progress” states
- One work item is in “Next up” state.
- A number of items are in the Kanban Backlog state.
The project’s Status Date has been set for Monday, September 19, 2022, which is one week ahead of the Project’s start date. For this scenario, we are going to build our cumulative flow diagram from scratch.
Building a Cumulative Flow Diagram
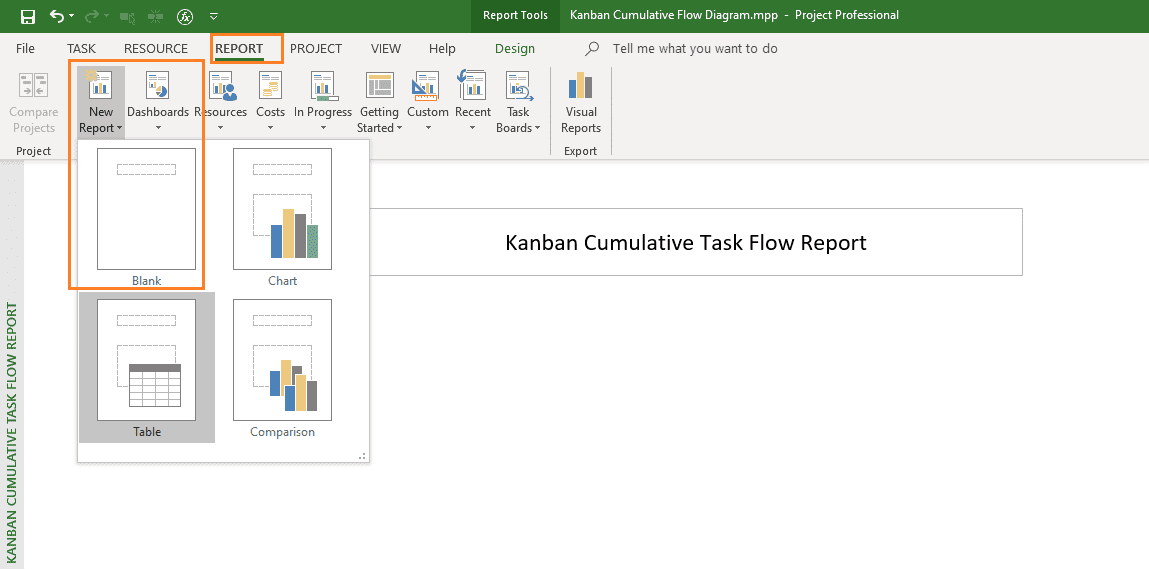
To create a CFD, first we have to go to the Report tab > View Reports group > New Report command and choose Blank report. The dialog box opens, and the report named, Kanban Cumulative Task Flow Report, as shown below.
To create the first-cut of the CFD, we go to Report tools > Insert > Chart command and insert an Area chart.

As you insert the chart, you will have your first view of a cumulative flow diagram with two fields:
- Remaining Actual Tasks shows actual tasks remaining over the timeline of the project and is highlighted with a blue color.
- Remaining Tasks shows tasks remaining over the timeline of the project and is highlighted in an orange color.
This is depicted below with the number of tasks in the Y-axis and the timeline by date in the X-axis.

Next, we are going to customize this chart to provide more clarity and understanding.
Customizing a Cumulative Flow Diagram
To customize the chart, I’ll enlarge the chart area, add the data labels for both Remaining Actual Tasks and Remaining Task fields, and apply associated color coding to have more visibility. You can learn how to do such steps in this article on Sprint Burndown and Burnup Charts.
After you customize the chart, it’ll be as shown below.

Note:
- Data labels have been added for both Remaining Actual Tasks and Remaining Task fields.
- Data labels have been formatted for both these fields, with light orange and light blue colors, respectively.
- The Remaining Tasks start with a value of twelve and go down to zero when the project ends.
- The Remaining Actual Tasks start with a value of twelve and go down to ten as on the Status Date, which we have set earlier.
Now, the main part is the analysis of this data according to the Status Date:
- The Remaining Tasks are eight, whereas the Remaining Actual Tasks are ten.
- It means we are not actually completing tasks as we have expected or planned.
- We can see that we are somewhat behind our planned progress.
While this CFD shows the cumulative task flow report and informs on the progress of the tasks, it doesn’t inform on what is happening at the board level. In the earlier part of the article, I stated, that with CFD, we can find out where the bottleneck is in our workflow. We need to find out where the bottleneck is at the board level.
For that, we will use another cumulative flow diagram. There can be a number of variants, but we will focus on task workflow across the column states of the Kanban Board.
Cumulative Flow Diagram – Board Status
To change the above CFD into a chart with Board Status, we have to apply the built-in grouping available in MS Project: Board Status.
We can rename this report in the Organizer by going to Report tools > Design tab > Report group and using the Manage command, or we can create a new CFD report entirely. Let’s create a new report and following the previously mentioned steps. The new “Kanban Cumulative Flow – Board Status Report” is shown below:

To create this report, we had to apply the “Board Status” built-in group. This can be done by going to the Field List command pane (as you select the chart area) and changing the Group By setting to Board Status (under Tasks). It’s highlighted in the figure.
Next, I’ll customize this chart by adding, formatting, and adjusting the data labels, etc. See below.

Let’s interpret the above figure, as of the Status Date of September 19, 2022:
- The work items in the “Done” board state (at the bottom of the chart) are progressing properly.
- The work items in the “In Progress” board state (just above the “Done” state) are also on track.
- The work items in the “Kanban Backlog” board state are not moving as expected.
- For this board state, the Remaining Tasks are highlighted in light blue, and the Remaining Actual Tasks are highlighted in green.
- As on the Status Date, the Remaining Tasks are seven, but the Remaining Actual Tasks are five in number.
Looking at the above CFD, one can say that movement of work items is not happening from the “Kanban Backlog” state to the “Next up” state. The “Next Up” board state is also having a narrower band. Hence, the bottleneck is there.
There can be many possible reasons for it. A few are listed below:
- Perhaps the team is behind on analysis to be done before moving the tasks from the “Kanban Backlog” state to the “Next up” state.
- Maybe the team has been occupied by some other work, hence the items from the “Kanban Backlog” state are not being moved out faster.
This has to be analyzed by the project manager (PM), the Kanban Flow Master, or whoever is in a similar role. Kanban explicitly doesn’t prescribe a particular role, but indicates respect the current roles, responsibilities, and titles.
Determining the ‘Work in Progress’
Another advantage of Kanban CFD is the ability to determine the work in progress (WIP) for the project. This is in-line with another fundamental aspect of Kanban: Limit the work progress.
Let’s do a little bit more customization for the above chart by keeping only the Remaining Actual Tasks in the view. I’ll also change the date range from project Start Date to Status Date below:

As shown, we can now quickly determine the total number of work items in progress:
- Done state = 0
- In progress state = 2
- Next up state = 1
- Kanban Backlog state = 7
Hence, the following is true:
WIP = 0 + 2 + 1 + 7= 10
Kanban emphasizes limiting this work progress for the purpose of smoothing the process flow. The WIP limit is usually driven by the organization’s policy and can be adjusted for the project under consideration.
Demonstration and Analysis
To demonstrate the charts that we just created and analyzed, take a look at the below video [duration: 10m: 37s], which I’ve prepared in support of this article. The content of the video is from my course, Mastering MS Project 2019 Agile. For the best experience, you may want to go full-screen in HD mode and plug-in your earphones.
Conclusion
As noted earlier, the main purpose of using a Kanban cumulative flow diagram is its assistance in managing the flow of work. Unlike Scrum, where you have Sprints, in Kanban, flow is emphasized. A CFD also helps in visualizing the workflow, understanding the work in progress, and identifying necessary process policies.
One can also use a cumulative flow diagram to analyze other Kanban metrics, such as:
- Cycle time
- Lead time
- Response time
- Little’s law, etc.
Remember to be judicious while using cumulative diagrams. For example, it does not inform how big or small the tasks are. Also, I’ve seen Kanban practitioners using the scale in X-axis on days when a high number of issues or work items are being worked upon. If you do that, you won’t get any value out of it. Another scenario is working with Hybrid-Agile projects. Some practitioners create CFDs for the entire project, which gives no value. You need to customize your CFDs only for the work items, which are pulled-based and just-in-time with an on-demand delivery pattern.
I hope that this article has given you have a fair understanding on how to work with cumulative flow diagrams within MS Project. Your comments are welcome below.
References
[1] NEW Online Course: Mastering MS Project 2019 Agile (Scrum and Kanban), by Satya Narayan Dash
[2] NEW Certification Course: Certified Hybrid-Agile Master with MS Project, by Satya Narayan Dash
[3] Online Course: PMI-ACP Live Lessons, Guaranteed Pass, by Satya Narayan Dash
[4] e-Book: I Want To Be A PMI-ACP, Second Edition, by Satya Narayan Dash
