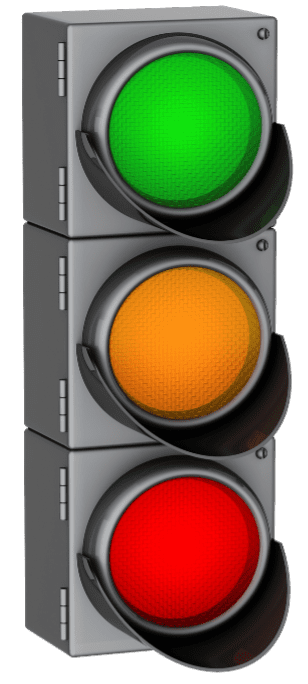
Displaying images or pictures instead of values makes it easier for you to spot project performance. For example, traffic-light icons can show project performance: a green light could mean the task is on schedule or the variance from the plan is acceptable, a yellow light could mean the task is a little behind schedule or the variance from the plan is slightly off schedule, and a red light could mean the task is in real trouble on many fronts. Let’s look at different examples of reporting values graphically within MS Project.
Indicators
The Indicators field shows symbols that give you a heads-up about different aspects of each task or resource. When you start a new project plan, the first column always has the Indicators field. As you generate and update your plan, you could see symbols appear (i.e., a task is complete, or a resource is overallocated and needs leveling). See the Indicators field in Figure 1. When you put your cursor over the individual Indicators, you will see what they stand for. In this case you will see the tasks that were completed on a certain day (blue check-mark) and/or there is a note from Task Information.
Figure 1: Indicators
Status Indicator
The Status Indicator field is the graphical version of the Status text field (i.e., Complete, On Schedule, Late or Future Task). See Figure 2 which shows Complete (blue check-mark), On Schedule (small check-mark) and a blank space for Future Task.
Figure 2: Status Indicator
Task Progress
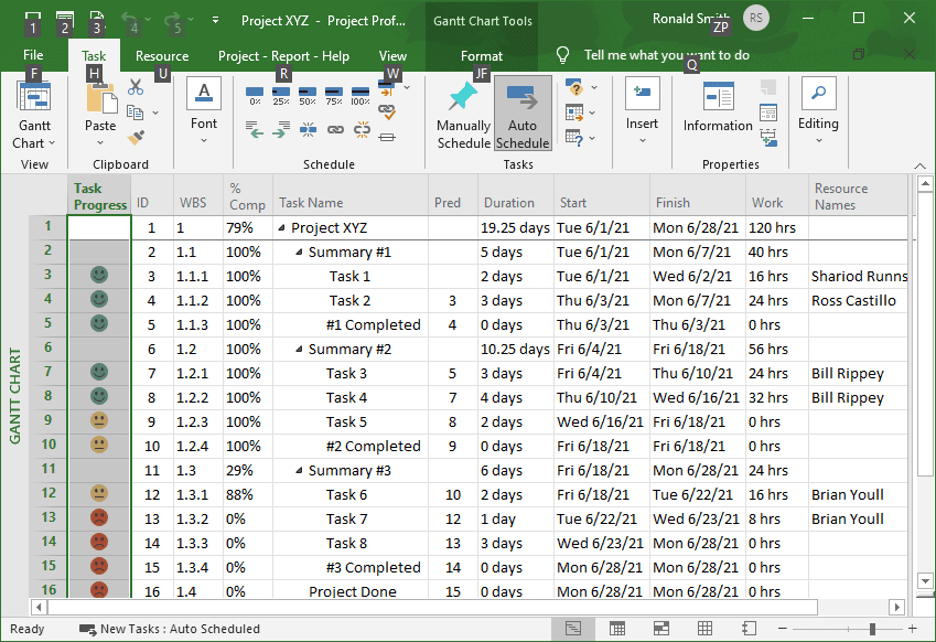
Figure 3 shows the Task Progress column (renamed Number 20 field) and shows three icons: happy blue-green face, straight looking yellow face, and unhappy red face. If you could put your cursor over the blue-green face, you would see the number 1. Likewise the yellow face would show number 2 and red face would show number 3. I inserted the numbers 1 – 3 based on the development of each task in the plan. I developed this project function by highlighting the Task Progress column and going to the Project tab > Properties > and clicking Custom Fields to get Figure 4. Also, notice at the top of Figure 4, you could select Resource for other project functions.
For the Field, I selected Number 20 which was previously renamed Task Progress and selected Graphical Indicators to get to Figure 5. I defined the image for each value and clicked OK twice. MS Project has over 500 fields, 80 of which include 1-20 for numbers, 1-10 for dates, 1-30 for texts and 1-20 for flags. These are all great fields to use for custom fields.
Figure 3: Task Progress
Figure 4: Custom Fields for Task Progress
Figure 5: Graphical Indicators for Task Progress
Formulas with Graphic Displays
We will basically be going through the above Task Progress exercise but include a defined formula along with the graphics. When using Project, you might need to work with values that do not reside directly in fields. Formulas enable you to work with fields to create these new values. For example, you might want to add the values from two different fields and save the answer in a new custom field.
The following is a simple example of using a formula. See Figure 6 for No Task Resource column flags. You will notice lines 9 and 14 are flagged because they have no resources assigned. I developed this project function by highlighting the No Task Resource column and going to the Project tab > Properties > and clicking Custom Fields to get Figure 7. For the Field, I selected Flag 1 which was previously renamed No Task Resource and selected the Formula button to get to Figure 8.
It takes a while to get the hang of defining your formula, but you have many buttons to pick from (i.e., Field and Function categories), most used function keys, and the very useful Help key. Also, if you have any errors in your formula, they will be highlighted when you click OK. The essence of this given formula is that we are not looking for summary or milestone tasks and only looking for “working” tasks that have no Resource Names. When that is completed, click OK and click the Graphical Indicators button to get Figure 9. When you are done defining your icons, click OK twice.
Figure 6: No Task Resource
Figure 7: Custom Fields for No Task Resource
Figure 8: Formula for No Task Resource
Figure 9: Graphical Indicator for No Task Resource
Summary
Visual indicators are simple illustrated graphics that only need a small amount of space and help the reader to see what is going on quickly. They can also aid in making predictions and informed decisions.
Do you use other visual indicators to assess project success, or will you experiment with ours? Your thoughts on this topic would be much appreciated.


