
 When you’re trying to keep your project on schedule, keep an eye on tasks. Task delays can push the project finish date later and upset the resource workloads you so carefully balanced during planning, creating resource over-allocations you need to resolve.
Watching for ballooning work hours is one way to spot tasks that are in trouble. Just like time that slips away when attic cleaning turns into reminiscing over old pictures, the time it takes to perform tasks can expand beyond your estimates. These extra hours can produce longer task durations and higher resource costs, so it’s especially important to nip these excesses in the bud.
This article, excerpted from my book, Microsoft Project 2013: The Missing Manual, shows you how to look for delayed tasks and tasks whose work hours exceed baseline work, even if they haven’t yet delayed the finish date. Here are different ways to look for these at-risk tasks.
Tasks That Are Slipping
The Slipping Tasks filter shows, well, slipping tasks — that is, tasks whose finish dates are later than their baseline finish dates. These tasks may be scheduled to start late, have already started late or are taking longer than planned. By looking for slipping tasks every week, you may have time to recover from the slip or to prevent it from getting worse. By applying different tables to the current view, you can see dates, variances, work amounts or costs for the tasks in the filtered list. To apply this filter, in the View tab’s Data section, click the Filter down arrow and then choose More Filters. In the More Filters dialog box, select Slipping Tasks and then click Apply.
Tasks That Are Slipping or Falling Behind
The Slipped/Late Progress filter (View | Filter | More Filters | Slipped/Late Progress) looks for slipping tasks and checks for tasks whose completed work is less than the amount that should be done. The finish dates of these tasks haven’t changed yet, but they’re likely to unless you do something.
To look for schedule trends, sort the Variance table by finish date: On the View tab, click Tables | Variance and then, in the table’s header area, click the triangle next to the Finish heading and choose “Sort Earliest to Latest.” That way, tasks appear from the earliest finish date to the latest. If the values in the Finish Variance field grow larger as the finish dates progress, the project is falling further behind over time. On the other hand, if the Finish Variance values are growing smaller, it may be a sign that your corrective actions are working.
Assignments That Are Slipping
It makes sense that an assignment that slips can turn into a task that slips. The Slipping Assignments filter (View | Filter | More Filters | Slipping Assignments) is a resource filter that you can apply to Resource Usage view to find assignments whose scheduled finish dates are later than their baseline finish dates. One resource with several slipping assignments is a sure sign of someone who could use some help. The problem may be too many tasks at the same time, the wrong skillset or too many distractions.
For Power Users: Seeing Status
Project offers a couple of features that can help you spot troubled tasks without filtering task lists, which is great because scanning for visual status cues is often easier than wading through numbers. You can customize fields so that they turn red, yellow or green based on progress. In addition, progress lines show whether tasks are ahead, behind or right on schedule in the Gantt Chart timescale. The figure below includes examples of the following status indicators:
Custom graphical indicators. To display graphics based on how late or over budget a task is, you can set up a custom field with graphical indicators like a green happy face if Cost Variance is less than 10 percent of the baseline cost and a red unhappy face if Cost Variance is greater than 25 percent of the baseline cost. The custom field “Number4 (Cost Status)” in ProjectMM_Customizations.mpp (available at does that and more, as long as you’ve already set a baseline and have some actual values in your schedule.
Progress lines. In the Gantt Chart Tools | Format tab’s Format section, choose Gridlines | Progress Lines. In the Progress Line dialog box that appears, turn on the Display checkbox and then click OK. Voila — Project displays progress lines in the Gantt Chart timescale. A progress line drops vertically from the project status date in the timescale heading and then points to the progress in each task bar. If the task is on schedule, then the progress line continues its vertical drop. If the task is behind schedule, then the progress line points sharply to the left.
If you add a deadline to a task, you can visually see when that task is due. If the task expands beyond its deadline date, Project displays a missed deadline indicator in the Indicators column of the view’s table.
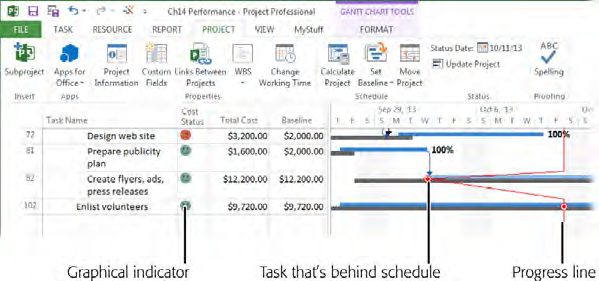
If you set up custom fields with graphical indicators, you can see status at a glance, like a red unhappy face for over-budget tasks (as shown here). Progress lines show whether tasks are ahead of or behind schedule. If the progress line diverts to the left, a task is behind schedule.
Watching Work Hours
Work hours that exceed a task’s baseline hours can increase your project’s duration and cost. For completed tasks, of course, it’s too late to make corrections. Still, it’s a good idea to investigate the reason why such overruns occurred, particularly if the same resources are over budget on task after task. You can also check tasks in progress to see if the amount of work you expect is complete. To do that, use one or more of the following Project features.
Work Table
The Work table shows several work fields: scheduled, baseline, actual and remaining work and work variance. It also includes % Work Complete, which is the percentage of the current scheduled work that’s done. (The sidebar below explains the difference between % Complete and % Work Complete.) Positive values in the Variance column show tasks whose scheduled work hours are greater than the baseline work hours.
You can look for tasks that may be falling behind by inserting the % Complete field next to the % Work Complete column in this table. If a task’s % Work Complete value is less than its % Complete value, time is passing faster than work is being completed, which is often early warning for future delays.
Work Overbudget Filter
The Work Overbudget filter (View | Filter | More Filters | Work Overbudget) shows tasks whose actual work has already exceeded the baseline work, so it’s already too late to recover from this overindulgence. However, if several tasks using the same resource are all completed over their work budget, you can try replacing that resource with one who’s more productive.
Slipped/Late Progress Filter
Although this filter tests for schedule slip, it has a work aspect, too. It looks for tasks in which the completed work is less than what you’d planned at this point. To apply it, choose View | Filter | More Filters | Slipped/Late Progress.
How Much Is Complete?
The Tracking table includes columns for actual dates, duration, cost and work, which are self-explanatory. However, the table’s other two columns, % Complete and Physical % Complete, may not be so obvious.
The % Complete field shows the percentage of a task’s duration that has passed; it says nothing about how much progress has been made during that time. For example, if five days of a 10-day task have passed, the task’s % Complete is 50 percent regardless of how much work has been done.
On the other hand, the Physical % Complete field lets you specify how much of the task is complete for earned-value calculations. Project doesn’t calculate this field. You have to type values like 20%, 50% and so on to tell Project the amount of completion to use. For example, suppose you’re working on a task to put up signs along the route of the cycling event. You have 100 signs to put up and you’ve stuck 40 in the ground so far. In that case, Physical % Complete is 40%.
% Work Complete is yet another field for percentage completion, although it appears initially in the Work table, not the Tracking table. % Work Complete is the percentage of actual work compared with scheduled work. If a task’s % Work Complete value is less than its % Complete value, that means the amount of work performed isn’t keeping up with the time consumed, meaning the task could be headed for trouble.
This excerpt was taken from Microsoft Project 2013: The Missing Manual by Bonnie Biafore. Published with the permission of O’Reilly Media, which holds the copyright.
