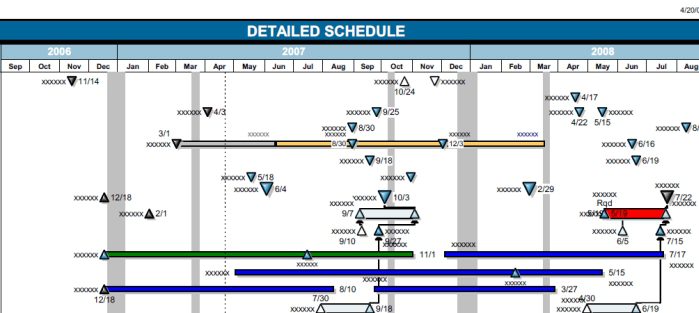
Communication on a lengthy, complex project isn’t a simple matter. Multi-year initiatives can require thousands of lines of detail in a project plan. Summarizing those details in an understandable way can vex even the most versatile project manager. Yet, a huge global defense contractor faced just that challenge. As an incentive requirement of a customer contract for building large engines, the defense company needed to come up with a way to make a roadmap that would fit on a single page and still be readable.
The vision was to communicate to the project stakeholders the program status, to enable them to execute decisions based on accurate, timely information. But the customer had found that without a one-page chart, people had trouble visualizing key assumptions. They couldn’t get their heads around how changes to various milestone events would affect the final delivery schedule, particularly when the project had multiple milestones being worked on by different teams.
Also, there were disconnects between project management tools. The integrated master schedule and program milestone charts being generated for team and customer meetings displayed data that didn’t always synch up. Charts had variations in formatting, information, and data display. Plus, they were being created manually, which meant that each time the schedule was updated, the charts had to be recreated manually too.
The defense company presented the customer with six different one-page samples, generated using Microsoft’s Visio, Excel, and PowerPoint. But, recalls Marilyn Buckelew, a planning analyst for the contractor, all of the samples were rejected. “The size of the print was too small. They couldn’t get five years’ worth of information into Excel or PowerPoint. The customer kept saying, ‘We can’t tell what’s going on. We can’t read it.'”
Buckelew happened to overhear somebody from one of the teams expressing concern about yet another deadline approaching on the project without a definitive solution to the requirement of the one-page report, and she spoke up. Buckelew had been using a product called Milestones Professional from KIDASA Software for other work, and she thought it would meet the requirements forthis project as well.
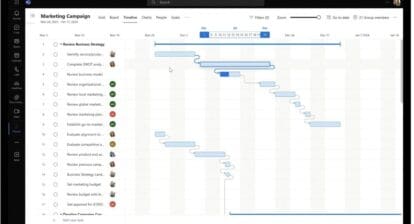
The primary purpose of Milestones is to generate a “bird’s eye view” of a project visually. As Buckelew explains, “You can choose the fields in Microsoft Project to pull out and display in a report giving the customer a high level visual of the project on one page.”
She worked with people at both her company and the customer to develop the reports that each team would eventually produce. “It was an iterative process as the people determined the appropriate level forthe data: ‘Are these the milestones you want to see?'” she says.
How A User Taps Milestones Professional
Marilyn Buckelew uses KIDASA Software’s Milestones Professional in multiple ways:
- To create freeform master phase schedules by manually tagging the symbols.
- To mark events such as reviews, in the master schedule using a flag field and then run a quick report, using Milestones Professional templates.
- To create a top-level roadmap from multiple programs, using a refresh feature. She says this is especially useful for executive project planning.
- To do “what-if” scenarios that show the impact of proposed changes to the master schedule through a baseline change request.
- To do monthly reporting after status updates.
- To share schedules with customers who don’t use Microsoft Project by creating a PDF or PPT files.
Now each of four teams uses Milestones monthly to generate a top-level chart created from data taken directly out of Microsoft Project plans. These are delivered to stakeholders, used in customer and team meetings, and posted to a bulletin board in the project team’s hallway, where they can be viewed and validated as people pass by.
“The visual nature of the reports really helps,” she notes. “It helps people see that big picture of how things fit together. Each team is focused on what they’re doing. It’s hard to see what the different handoffs are between the teams. These reports are a great communication starter to get people to talk with each other about collaborating on dates and handoffs, especially when there are baseline change requests.”
Eventually, the Milestones reporting project became a Six Sigma project, which showed that the shift from the manual chart creation to an automated approach that could be done in minutes removed $100,000 in project costs each year. The company for whom Buckelew works was able to claim the incentive reward stipulated in the contract, and,she adds,”increased customer satisfaction.”
“This tool and resource provides collaborative opportunities which make a huge difference not only in my work, but in the work done by the whole team,” Buckelew says. “It helps us get on the same page. It helps us see that one view. I’ve become a huge fan of Milestones Professional.”