
Summary
‘ Time Modeling’ is the simplest way of working with project scheduling applications (like Microsoft Project and Oracle Primavera) that everyone can learn in one or two days of training (‘introductory’ level). The ‘intermediary’ level is modeling time and workloads (‘Workload Modeling’ ), which requires you to learn many more features in your scheduling application and requires adding much more data to your schedule. After gaining experience with Time Modeling, Workload Modeling requires one or two additional days of training. The highest or ‘advanced’ level of proficiency with project scheduling applications is modeling the cost (‘Cost Modeling’ that includes time, workloads and cost) and keeping the intricate model of your project alive during the entire life of the project. This requires solid work experience with project scheduling applications, an additional few days of training, and, of course, executives that expect it to happen…
Proficiency Levels
Ever wondered what the commonly used terms ‘introductory’, ‘intermediate’ and ‘advanced’ mean in terms of Microsoft Project proficiency? Have you ever had to choose for your own professional development between an ‘introductory’, ‘intermediate’ or ‘advanced’ course in Microsoft Project? Were you forced to read the detailed course syllabus? In this article, we will propose a clearer way of describing the levels of proficiency for project scheduling in general, and Microsoft Project, in particular.
This article reflects some of the insights we gained from training 250 project managers at a large department in the Federal Government last year. These insights may help you strategize your own personal training or it may help a project management office purchase the right type of training for their community of schedulers, i.e. Microsoft Project users. Here is what we learned in 2016 during the delivery of twenty courses, each three‑days long, with about 12 project managers each, on average:
- The early groups of students we trained were very keen to learn; they picked up concepts quickly and could handle a lot of content. We trained these project managers in most, if not all, features in Microsoft Project: modeling the time aspect of the project, modeling the workloads of the resources, and some groups even how to model costs with a dynamic schedule.
The later groups of students were slower leaners, were often cajoled by their managers to take the course: They were more intimidated by Microsoft Project and more easily overloaded with information. Some of these project managers were simply ‘not ready’ to load resources into their schedule. We found ourselves as trainers having to switch from ‘effort-based scheduling’ (labeled ‘workload modeling’ in this article from hereon) to a simpler form of scheduling: ‘duration-based scheduling’ (labeled ‘time modeling’ in this article) for these later groups. We made this switch out of necessity even though everyone really needed to know workload modeling because almost all their projects were software development projects. - All project managers were expected to report on cost in Excel every quarter in this federal department, even though these reports could more easily be created and maintained in Microsoft Project since the projects often shift in time. In Excel, each project manager had to provide a cash‑flow report on what they had spent and what funding they needed in the remaining quarters of their fiscal year. This caused a lot of work in Excel when delays happened or when new deliverables emerged. In other words, these reports required brain surgery in Excel every quarter. The cash-flow reports could much more easily be maintained in Microsoft Project, because it reschedules costs automatically when delays happen and adds cost when new deliverables are added while preserving the original cash-flow in the schedule baseline (that was approved for the project). Why did this organization not expect their project managers to use Microsoft Project instead of Excel to report on cost? The answer is: ‘modeling cost’ is the most advanced use of Microsoft Project and requires the highest level of proficiency with this application that was not present in this organization, or feasible through training in the time given.
As you know, there are ‘predictive’ versus ‘adaptive’ approaches to scheduling. The mainstream predictive approaches are: Critical Path, Resource-Critical Path, Critical Chain, Earned Value, whereas the adaptive approaches are: Agile, Scrum, SAFe. This text discusses mostly predictive scheduling, after all, you model time, workload or cost typically for forecasting purposes.
Model Time, Workloads and Cost
We would like to present the following operationalization for the vague terms ‘introductory’, ‘intermediate’ and ‘advanced’ proficiency levels of using Microsoft Project that, by themselves, do not mean anything except a hierarchical ranking between them: [1]
- Introductory: model Time only (‘Time Modeling’): You model the duration and finish date of the project in order to monitor if your project will finish on time. The time model allows you to view the most current duration of the project continuously and, therefore, control the duration of your project better. It increases your chances to finish the project on time.
- Intermediate: model Time and Workload (from here on simply referred to as ‘Workload Modeling’): Portfolio and Resource managers may be asking you for the resource requirements for your project before approving your project, which requires modeling the workloads in Microsoft Project. Resource requirements are most often reported as number of Fulltime Equivalent Employees – FTE’s – by role by month. Once the project is approved, you need to model the total workload for each resource in detail for determining: If the workloads of all team members are reasonable and if they are evenly spread between them. In other words: If the project is feasible from a resourcing point‑of‑view.
- Advanced: model Time, Workload an Cost (from here on simply referred to as ‘Cost Modeling’): you attempt to model the cost side of your project in order to monitor if you are staying within the project budget. The cost model allows you to control the expenses of your project better and increases your chances to keep the project within its budget. Earned Value Management (EVM) is an example of a specialized case of modeling cost: If you need to implement Earned Value, you will need advanced schedulers that know how to model cost in Microsoft Project. This may explain why many organizations struggle with making Earned Value really work even with the current drive of the US Government to implement it on major capital programs.
Hierarchy
There is hierarchy between the different types of modeling: if you want to model workloads, you will have to build a time model as well and, probably, first. If you want to build a cost model, you will have to build a workload model first (that needs a time model). You can see this hierarchy in the next illustration depicted as the steps of a staircase.
Progressive Elaboration
There is also progressive elaboration to get from one level to the next level: With every step up, people will need to add more data to their schedule model. The illustration indicates what data needs to be added at each level. You can elaborate a time model and convert it into a workload model; we estimate that the amount of data is about 20 times the data in a Time Model; there are typically 7-9 activities per deliverable plus all resources plus assignments on each activity. If you spent some more time planning, a workload model can be transformed into a cost model; we estimate that the amount of data doubles going from a Workload Model to a Cost Model.
In summary: if you have a time model with 50 pieces of data entered (line items and fields), you will need to enter about 1,000 more pieces of data to get to a Workload Model and then another 1,000 pieces of data to get to the Cost Model, to a grand total of 2,000 pieces of data (which, by the way, is NOT the number of tasks; the number of tasks may only be 300 in this Cost Model). You can see the level of detail and the amount of data grow significantly when progressively elaborating your dynamic models from a Time Model, to a Workload Model and, finally, to a Cost Model. Therefore, you really need to ask yourself at the start of each project: What do I really need for this project: a Time Model, a Workload Model or a Cost Model?
Three Levels of Proficiency in Scheduling Projects
The illustration lists what data should be added at each level of progression:
- In order to monitor if a project is on time, you need to capture at least:
- Deliverables,
- Duration estimates,
- Dependencies between the deliverables
- Deadline dates
Do not enter Dates in Start or Finish fields, because this creates many date constraints and a rigid model. Notice all these words start with a ‘D’, so we normally refer to this with our mnemonic ‘4D‑1D scheduling’.
- In order to monitor workloads, you need to add to the time model the following:
- Activities that will create each deliverable.
- Availabilities: You need to enter all generic resource roles and/or actual resources (people of flesh and blood) and their availability to the organization (capacity).
- Assignments: Who will do what activity.
- Assignment Effort: Activity Effort is the effort estimate expressed in person hours that is needed for each activity, which is captured in the field ‘Work’ in Microsoft Project.
- Assignment Units: The number of resources working on the task when assigning generic resources OR the percentage of the availability an individual will work on the task (when assigning individuals).
All these terms start with an ‘A’, so we refer to ‘ workload modeling ’ also as ‘ 5A-scheduling ’.
- In order to monitor the cost of a project, you need to add more data to the workload model:
- Capital Available: The capital available is the budget as approved,
- Charge Accounts: Account categories from the budget in a lookup table visible in a custom field in Microsoft Project to tag tasks, resources or assignments with these charge accounts.
- Cost and Material Resources: Cost resources and Material resources to capture all other expenses needed for the project.
- Charge Rates: These are the StandardRate, Overtime Rate and Cost per Use for each resource Many organizations use so-called blended ratesthat are average rates for each role, so HR does not need to reveal each person’s salary that is information considered private.
- Cost Accrual: Cost accrual is when the costs accrue (i.e. should be charged) to the project; the options are: At the Start or Finish of an assignment, or Prorated – spread out over the duration of the assignment.
- Changing Rates over Time: How rates change each calendar year (a.k.a. rate escalation).
All these terms start with a ‘C’, so we refer to ‘cost modeling’ also as ‘6C‑scheduling’.
As you add more data, the schedule model becomes more complex and will require more effort for keeping it up-to-date. As you can see, each next-level model needs the previous, simpler model(s) as a starting point, as input:
- Before you can create a Workload Model, you need to have a complete Time Model.
- Before you can create a Cost Model, you need to have a complete Workload Model (that needs a complete Time Model).
Tip► As you can see, there is natural progression between these different types of modeling while learning your scheduling application: We recommend that people start with modeling the time of their project first, then try to model workloads, and, eventually, round of their skillset with modeling costs.
Time Model Example
We will look at a house renovation project to illustrate each type of model. By the way, this is the project schedule I created for the renovation of my own home, so it is a real-world example.
The time model of this project looks like a Gantt Chart with all Deliverables, all Durations and all Dependencies; some of the deliverables have Deadlines but no Start or Finish Dates (4D‑1D scheduling):

As you can see, it is a small schedule, but all pertinent information is there for this 4D-1D time model. You can also see that this schedule is a very simple model of the project that can easily be explained to any stakeholder. Regardless of its simplicity, this schedule allows you to forecast the project:
- Deliverables: All deliverables, the things of value to the client, are listed.
- Deadline: Deadlines are promised dates, or, in this project, the contractual dates between the owner of the house and the general contractor. The agreed-upon dates are entered for each deliverable as captured in the home renovation contract; they are entered into the Deadline date field.
- Durations: The general contractor came back to me with durations estimates for each deliverable and I entered them into the time model.
- Dependencies: The relationships between the deliverables are captured on a high-level: For example, we wanted the Water System and Septic System out of the way before the renovation of our home was started.
You can see that I used some tricks to make the Gantt Chart look nice:
- I colored all milestone text (ribbon Format, button Text Styles) and all milestone diamonds (ribbon Format, button Bar Styles) red to make them stand out.
- You can see that I created a new field called: Total Slack until Deadline: Microsoft Project does not calculate the Total Slack from the Deadline date back in the backward pass. Instead, it calculates from the Early Finish date of the project back. So, I added this custom field Text1 with the following formula to see how many days were left before the deadline as captured in the contract:
IIf([Deadline]<#12/31/2149#,[Deadline]-[Finish],””)
Note, the date #12/31/2149# is the end of the timescale in Project 2016 ; unless there is a valid Deadline date for the milestone, the formula will output nothing in this field. As you can see, there are only three milestones with a Deadline date entered.
It allowed me to see how many days are left until the contractual deadline dates, a very useful tool when working with general contractors (and any other vendors for that matter). It allowed me to regularly ask the question to the general contractor and his trades people: There are X days left for you to finish this task; will you make it within this timeframe? - I wanted to see that the amount of Total Slack until Deadline increases from the start of the project, via all milestones to the end of the project and you can see that it does go up from 10 to 50 days and then to 74 This is the hallmark of a healthy schedule. The further into the future, the larger your time buffer needs to be, so you can accommodate the unforeseens (‘known unknowns’ and ‘unknown unknowns’).
Workload Model Example
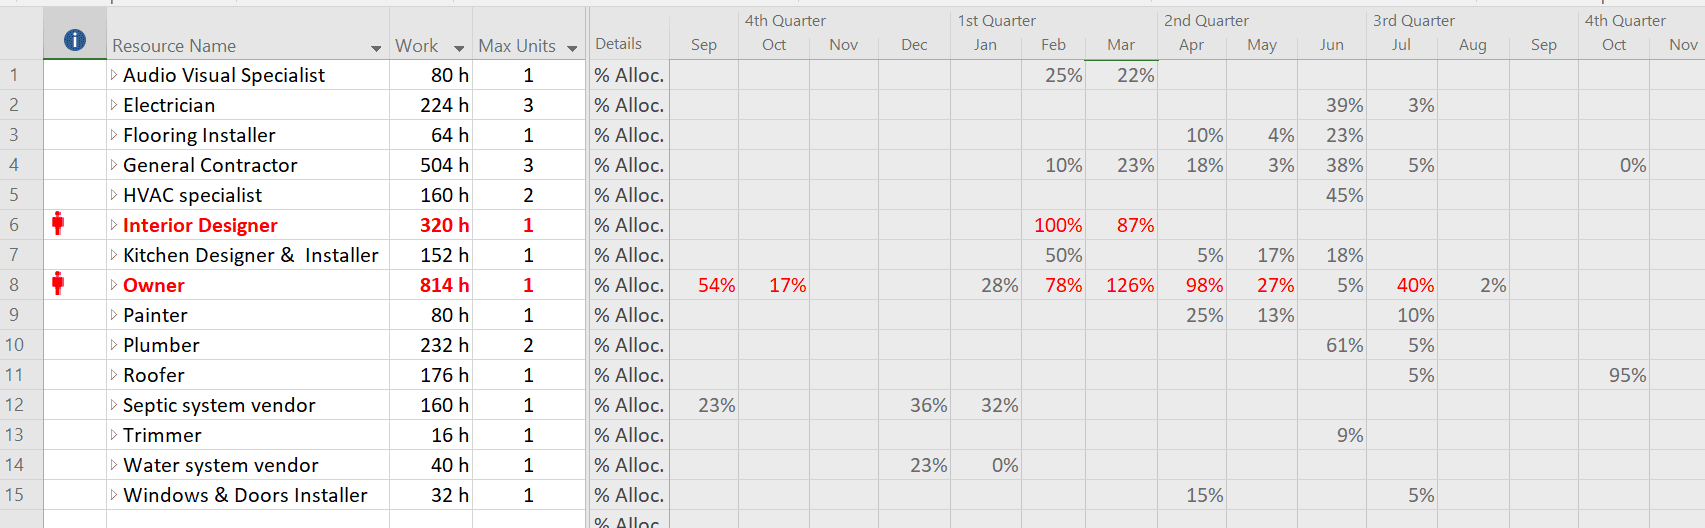
I have now taken the Time Model and added the 5A’s to it: Activities that create each deliverable, the Availabilities (all resources and their availabilities to the project, and Assignments of resources to activities, the Assignment Effort (field ‘Work’ in Microsoft Project) for each activity, and the Assignment Units, the number of generic resources working on the task, or the percentage of an individual’s working time to be spent on the assignment. One of the main outputs of the Workload Model is a view that displays the aggregated workloads by resource in the project; you can then check if they are reasonable: i.e. if they fall within (reasonable boundaries of) the availability of the resources. We developed the following Resource Usage view with the field Work replaced with % Allocation (ribbon Format, button Add Details). You can see that the workloads are fairly reasonable: everybody is below 100% allocation, except for the Owner (me!) who has some overtime in March: 126% allocated:
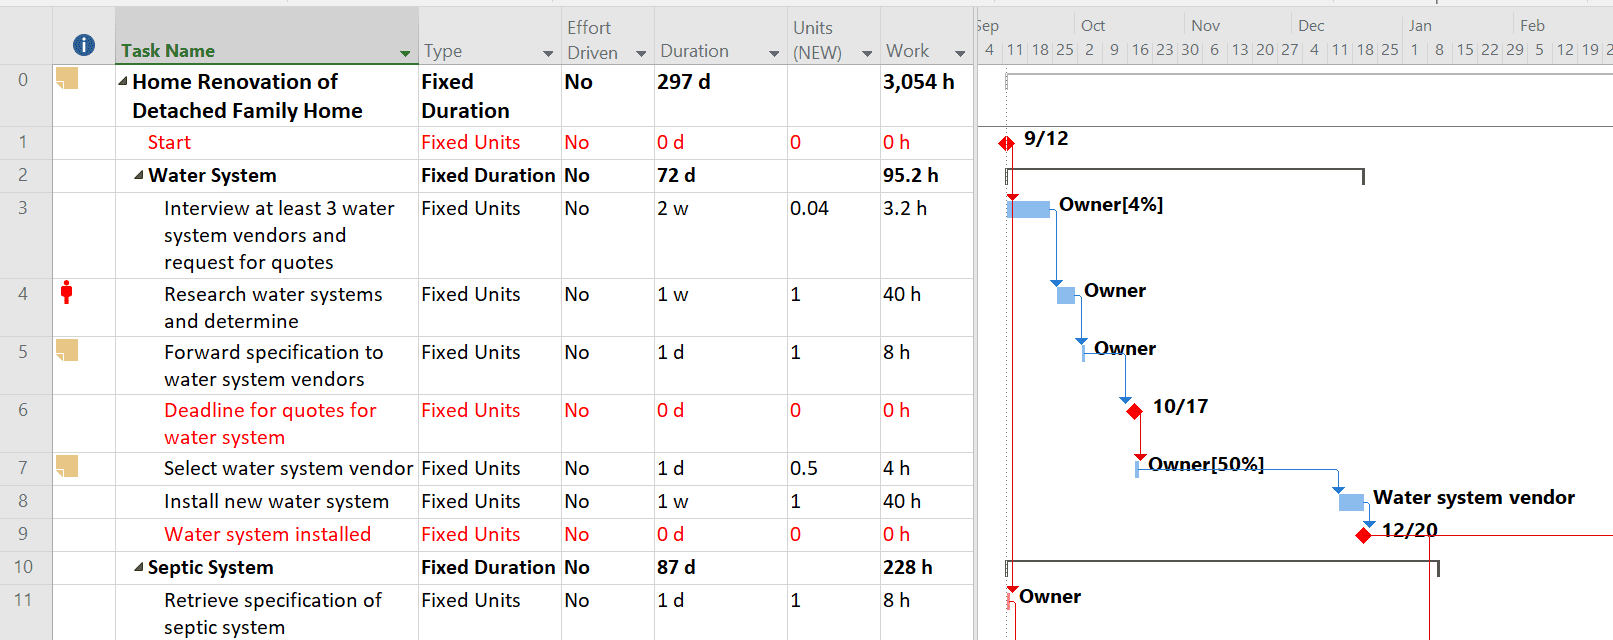
The model has expanded from 11 line‑items in the Time Model to 183 line‑items in this Workload Model AND more fields needed to be filled in for each line-item that is an activity: Assignment (field: Resource Name), Assignment Effort (field Work), and Assignment Units (=number of people assigned), not to speak of Type, Effort Driven. You can see that the amount of data loudly exploded by a factor of 20 (!) and that it is a lot more challenging to create this workload model during project planning and that it requires a lot more effort maintaining it during the project execution phase, realizing that execution is already hectic and will always be. In the following screenshot, you can see a small part of the Gantt Chart of our Workload Model, i.e. the activities I performed to sort out the Water System deliverable:
Here are some tricks I added to this Workload Model:
- Notice that I carefully entered the Units for each assignment; there were many activities that take a lot of elapsed time (column Duration) but not much effort (column Work); for example, observe activity ‘3 Interview at least 3 water system vendors’; it takes 2 weeks to meet with three vendors and each meeting only takes about one hour, which leads to an assignment percentage of only 4%, or 0.04 in field Units (NEW). These are the details that you need to capture correctly in order to model workloads accurately.
- Notice the number of resources assigned to each activity is expressed in terms of a Percentage, i.e. 4%. You can express it also in Decimals (e.g. 0.04) as set in the options: Ribbon File, item Options, tab Schedule, under Show Assignments Units as a.
- Notice the field Units (NEW) that I inserted between the out-of-the-box fields Duration and Work. This is a custom-made field I published and recommended in my book Forecast Scheduling [1] that always reflects the latest number of resource units (unlike the Units field in the Assign Resources dialog that since MS Project 2010 reflects the last, manually‑entered value). I used one of the extra fields in MS Project: The Number1 field (insert Number1, right-click on it and click Customize Fields, button Formula). Our customized Units (NEW) field has the following formula:
IIf([Resource Names]=””,”No Resources”,IIf([% Complete]=100,”Complete”,IIf([Remaining Duration]=0,0,CSng([Remaining Work]/[Remaining Duration]))))
The essence of the formula is the last bit where [Remaining Work] is divided by [Remaining Duration] as per the formula hard-coded into MS Project that we discuss extensively in the Forecast Scheduling book:
Duration * Units = Work
OR
Units = Work / Duration.
Cost Model Example
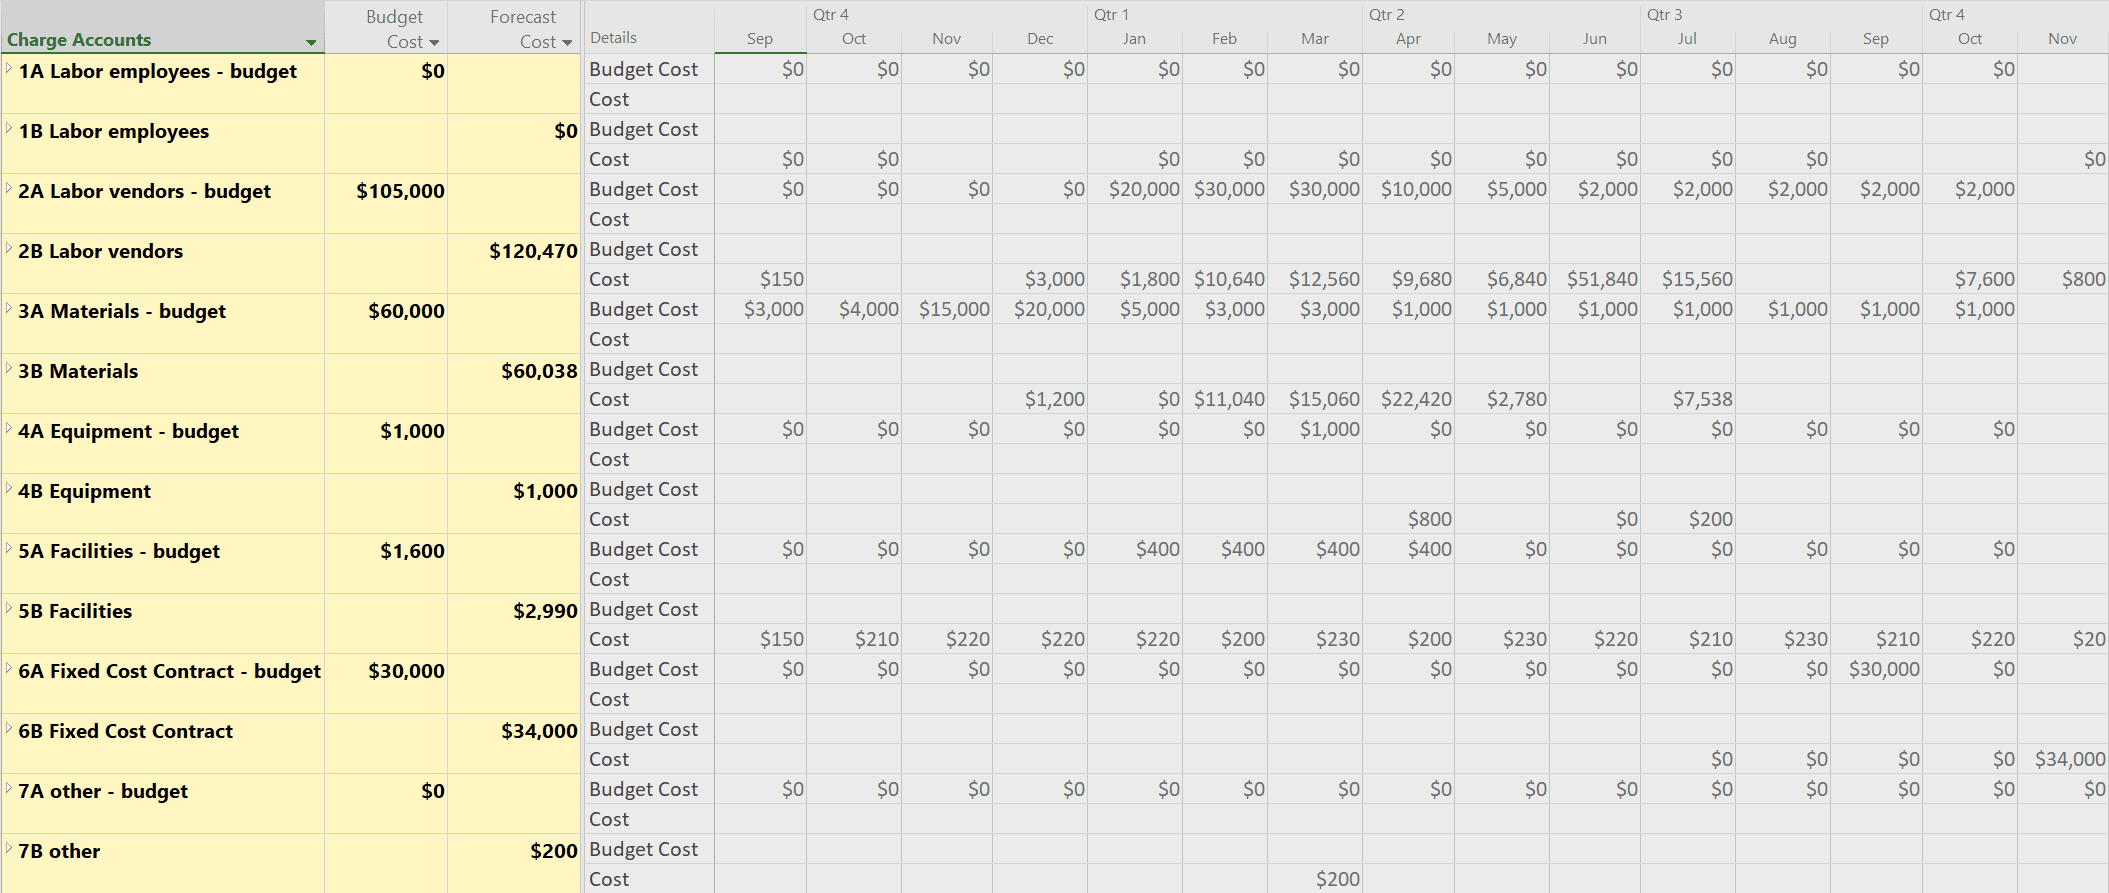
At this point, we take the Workload Model and we add the following 6 C’s: Capital Available (approved budget), Charge Accounts (expense categories), Cost and Material Resources, Charge Rates (Standard Rate, Overtime Rate and Cost per Use), Cost Accrual (Start, Finish or Prorated), and Changing Rates over Time. One of the main outputs of the Cost Model is an overview that shows if you are still within budget or if you are going over: We developed the following output based on the Task Usage view:
Here are some tricks I applied to get to this representation of the cost of the project:
- I sorted the Charge Accounts exactly the way I wanted by giving them numeric prefixes (1A, 1B, 2A, 2B, etc.) in the Value field. Note that MS Project in the Edit Lookup Table dialog, displays the Descriptions (if filled in) as the names of the group, but it sorts by its Values which is funny. In short, the numeric prefixes need to be entered into the Value field; you can leave the Descriptions field blank.
- I renamed the Task Name column heading to Charge Accounts in the Field Settings dialog (right-click on column heading, click Field Settings)
- Pay attention to the alignment of money amounts in the Field Settings dialog (right-click on column heading, click Field Settings); money should be right-aligned.
- Get rid of the decimals in ribbon File, item Options, tab Display.
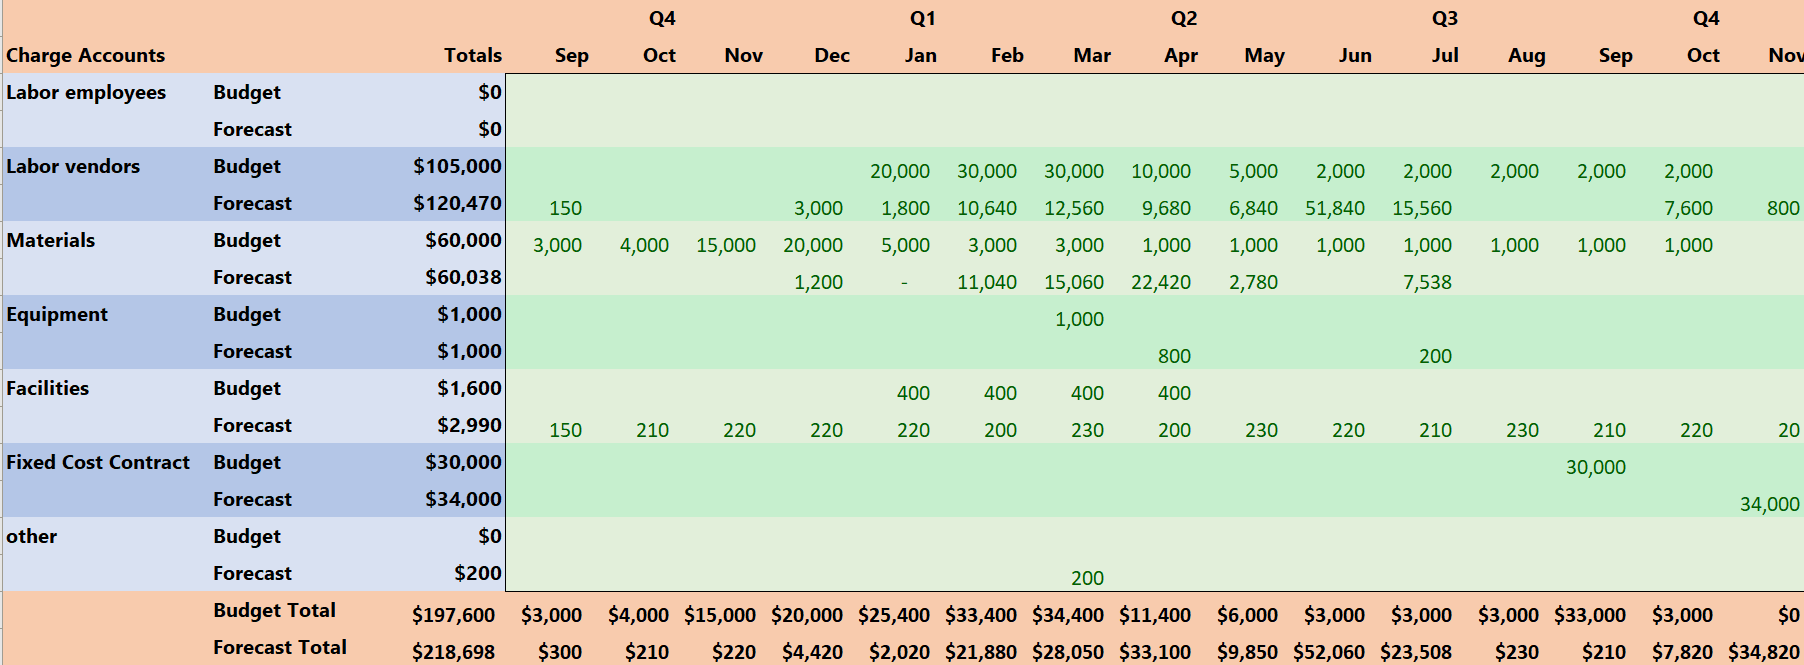
If you are not entirely happy with the way MS Project lays out the information, you can copy and paste into Excel and make it prettier. Copy first the Charge Accounts, then the numbers in the timescale:
Notice that the number of resources doubled (as shown in the following screenshot of part of the Resource Sheet) when adding the cost and material resources to the schedule. Renovation projects typically have many Material resources, whereas IT-projects have more Cost resources (licenses, royalties, travel, facility rental, etc.):

All these material resources were then assigned to the appropriate activities.
Here are the tricks I applied to create this view:
- The Material Label field is important for Material resources, because their label shows up in the Gantt Chart timescale when you start assigning them to activities, for example, in the following way: Trim Mouldings [20 meters] where Trim Mouldings is the resource Name and meters is the Material Label (see also next screenshot).
- Notice that you need to pay attention to the field Accrue At in renovation projects: Most vendors are paid at the End, whereas all materials are paid upfront (Start).
- Sorted the resources by name as follows in ribbon View, button Sort: Sort by: Type, Descending, Then by: Name, Ascending and I used þ Permanently renumber resources to get the alphabetical list and corresponding sequential ID-numbers that you see in the previous screenshot.
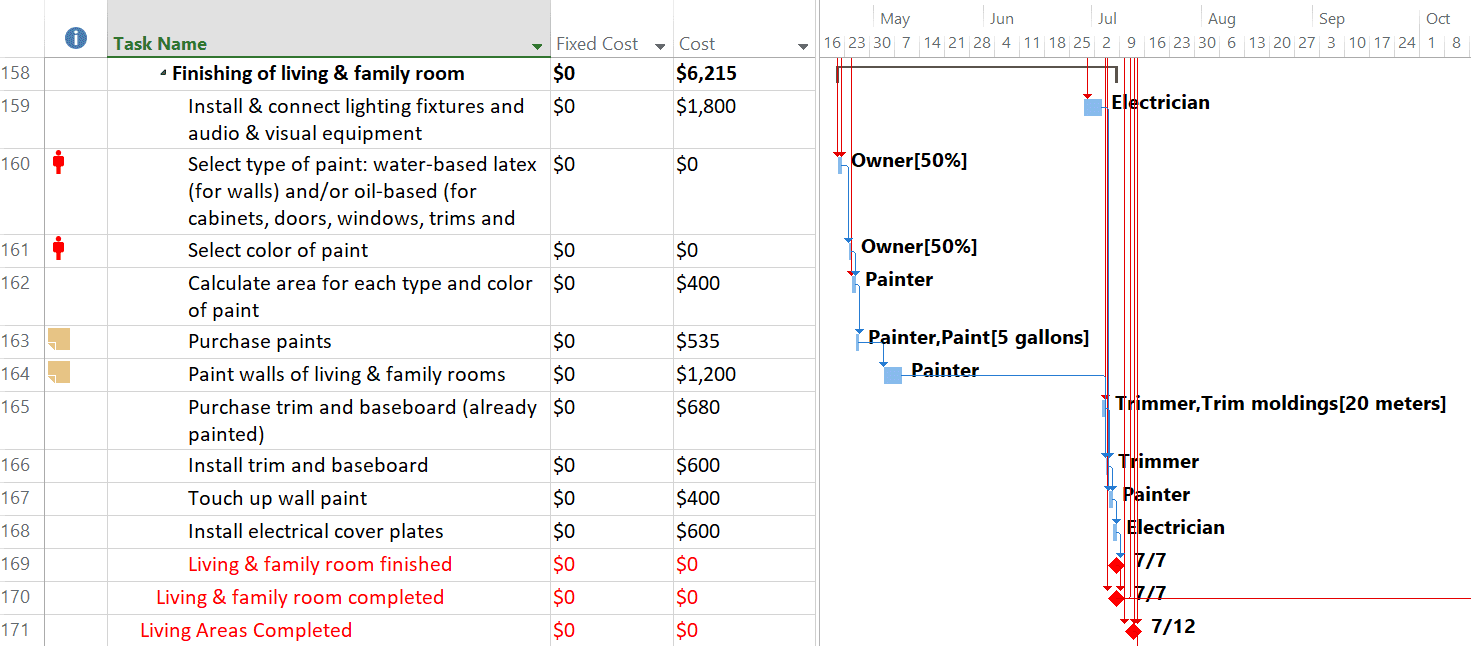
After entering all Cost and Material resources, they needed to be assigned in the exact quantities as per the architectural drawings: See Trim Moldings [20 meter] assigned to task 165:
Benefits of the Time, Workload and Cost Model
The main benefits of each model are:
- Time model: You will be able to tell if the project is on time at any time as long as you keep the lean-and-mean model up-to-date during project execution. Another benefit is that you will spend very little effort on scheduling the project as well as on maintaining the project schedule during the busy execution phase of the project.
- Workload model: You will be able to tell if all workloads are within the availability of the respective resources. Also, you can spread the workloads evenly and tell if more projects can be authorized by portfolio managers. Meanwhile, you still have the Time Model as well (that is a subset of the Workload Model) and its benefits: You can tell if the project is on time.
- Cost model: You will be able to tell if a project is still on budget. Meanwhile, you still have the Time Model and Workload Model as well and their benefits:
- Time Model: You can tell if a project is on time.
- Workload Model: You can tell if all workloads are within the availability of the resources and if the workloads are spread evenly.
Scheduling Maturity
The scheduling maturity of project managers in your organization determines which type of model you can request and expect from the project managers:
- If the maturity is low, we recommend you aim for time modeling.
If you have new project managers or ones new to scheduling, the scheduling maturity is likely low and we recommend you ask them to use the simplest way of scheduling: time modeling. We often introduced this as ‘duration-based scheduling’ to our client organization. - If the maturity is medium (and the projects involve a lot of labor and resources), we recommend you aim for workload modeling.
If you have project managers who have created some schedules in Microsoft Project, their maturity may be medium and you could ask them to model the workloads in Microsoft Project (workload modeling) if its main benefit is of value to your organization. We often introduce this as ‘effort-based scheduling’ at our clients. - If the maturity is high (and your project managers have cost responsibility), we recommend you aim for cost modeling.
If your project managers have created many schedules in MS Project and have implemented the best practices of scheduling, they are mature schedulers and you could ask them to model the cost in Microsoft Project (cost modeling) if this provides additional benefits to your organization.
The following illustration depicts these recommendations with green checkmarks in white cells. You can see that the chart also shows some question marks and red crosses. The question marks depict situations that can be remedied with training. The red crosses depict situations that are in our opinion:
- Undesirable (top-left): If your organization needs simple time models, you should not hire highly-mature project managers, because this would be a waste of money on their high salaries.
- Unattainable (bottom-right): If you have low scheduling maturity, you cannot expect your project managers to start building dynamic cost models of their projects.
However, the situation of your project might impose the type of scheduling that you will need. For example:
- You may have low mature project managers, but a large program needs to be carried out by your organization (e.g. business transformation, upgrade of core business system, ERP-implementation). Such a large endeavor may require reporting on cost and, therefore, cost modeling in Microsoft Project for which you need highly‑mature project managers and program manager. You will need to pay special attention to closing the gap by: training your project managers, hiring new highly-mature project managers, or contracting vendors to attract highly‑mature project managers.
- You work for an engineering firm that wins a contract with the US‑Government on a capital project, which means that you will have to implement some flavor of Earned Value scheduling depending on the contract value. Earned Value is an advanced cost modeling technique that requires a lot of scheduling discipline and, therefore, high maturity. In this situation, you will also experience a gap that you will need to close.
Conclusion
In summary, Time Modeling is the simplest way of working with Microsoft Project that everyone can learn in one or two days of training (introductory level). The next, intermediary level is modeling time and workloads (Workload Modeling), which requires you to learn many more features in Microsoft Project and adding a lot more data to your schedule. This requires two additional days of training after gaining work experience in Time Modeling. The highest or advanced level of scheduling with Microsoft Project is modeling time, workloads and cost of your project (Cost Modeling) and keeping this intricate model of your project alive during the entire life of the project. This requires solid work experience with Microsoft Project, another few days of training, and, of course … executives that expect it to happen.
Eric Uyttewaal, PMP, former MVP in Microsoft Project
President ProjectPro Corp.
www. ProjectProCorp.com
Tel. 613-692-7778
This is one section of Eric Uyttewaal’s NEW 400-page textbook ‘Forecasting Programs ’ that will be published on Dec. 11, 2017. Project managers need to decide what kind of project schedule they intend to create: a Time Model, a Workload Model or a Cost Model. These different kinds of schedules also match increasing levels of scheduling proficiency in the order they are listed. Pre-order your copy of Eric’s book NOW at a 33% discount at: https://projectprocorp.com/collections/frontpage/products/forecasting-program-book
[1] In my book “Forecast Scheduling with Microsoft Project 2010/2013”, I already used three different approaches to optimizing schedules: ‘Optimizing for Time’, ‘Optimizing for Time and Cost’ and ‘Optimizing for Time, Cost and Resources’. The three levels in the chart were inspired by that threesome, but I flipped the last two levels to bring them in line with the natural progression.
Related Content
Webinars (watch for free now!):
Task Planning using Microsoft Project
What’s the value of Schedule Risk Analysis?
Articles:
Levels of Project Scheduling Proficiency
Are You Using the Team Planner View Feature in Microsoft Project?
Resource Leveling: Scheduling vs. Leveling
