Introduction
Many clients are now demanding that proposals include a schedule risk assessment, and the more savvy are requesting forecast dates be presented at, for example, 80% levels of confidence. What does this mean? And how much effort will be involved to produce these deliverables? The following article will focus on how to satisfy these requests with minimum effort and how schedule risk analysis can actually reduce costs and improve profitability.
Everything is subject to uncertainty!
Consider the following schedule:
The scheduling tool above is projecting a project completion at 5pm on October 15th.
Despite the simplicity of this schedule, the uncomfortable truth is that the chance of completing this project at 5pm on October 15th is very small. Since everything is subject to some uncertainty, the project might finish a little early or perhaps a little late.
Best practice is for task duration estimates to represent the most likely time the work should take, and assuming symmetrical uncertainty (it’s just as likely to finish early as late), we could extrapolate that we also have a 50% chance of the project completing on-time or early. Unfortunately, that’s also a 50% chance of delivering late!
Now consider this schedule:
The scheduling tool is again projecting a project completion at 5pm on October 15th.
However, consider our thesis that everything is subject to some uncertainty. How will the increased complexity of the schedule (two fabrication tasks) affect the chance of an on-time delivery?
Let’s again assume that all tasks are just as likely to finish a little early as a little late. Because of the schedule logic, the Inspection task cannot start until both Fabricate 1 and Fabricate 2 are complete.
Here is a tabulation of the possible results for the Fabrication tasks and their impact on Inspection.
| Fabricate 1 | Fabricate 2 | Inspection |
| Finishes On-time or Early | Finishes On-time or Early | Starts On-time or Early |
| Finishes On-time or Early | Finishes Late | Starts Late |
| Finishes Late | Finishes On-time or Early | Starts Late |
| Finishes Late | Finishes Late | Starts Late |
The Inspection task only starts On-time or Early in one of the four possible outcomes. That’s a 75% chance of starting Late! The project logic will carry this delay through to project Completion resulting in a 75% chance of the entire project completing late.
This simple effect is called Merge Bias and influences our chance of delivering on-time regardless of how excellent our task estimates and execution time.
The situation gets worse when you consider that, in the real world, tasks tend to take longer than estimated more often than they finish early.
So, a completion/delivery date projected by typical scheduling tools tends to be overly optimistic and typically has a less than 50% chance of being achieved. This is not a criticism of critical path method (CPM) scheduling tools or their users, but a recognition that we need a further step to get better forecasts.
Clients and contractors are now recognizing that projects are often delivered late, not due to poor estimates or poor execution, but simply because typical scheduling techniques do not allow for the likely impact of uncertainty.
Enlightened clients are no longer asking for a completion date, but rather an estimated completion at a specific level of confidence. So, how do we deliver these estimates?
Want to learn more about Schedule Risk Analysis? Watch John’s webinar, What’s the value of Schedule Risk Analysis? available on-demand
Improving our Estimates
Before we get into the nuts and bolts of improving our forecasts, the importance of a good schedule cannot be over emphasized.
- The schedule must be logic driven! This means no manually scheduled tasks or fixed constraint dates (Must Start/Finish On etc.) that prevent tasks moving into the future.
- Care should be taken that any tasks representing overhead (LOE) cannot become part of the critical path to a deliverable.
- Any tasks representing Schedule Margin should be removed before analysis.
As we’ve already seen, recognizing that all estimates are subject to uncertainty is the first step. What this means is that we need to capture a range of duration estimates rather than a single fixed point for each task. This sounds like a lot of additional work at first. By focusing our estimating effort on critical, near-critical, and known high-risk tasks, we can capture best case, worst case, and most likely estimates (known as a three-point estimate) along with a profile (distribution type) that shows how likely we think the actual duration will be. In this scenario, we’ll be closer to the most likely outcome compared to the best or worst case extremes.
To reduce effort, it is possible to use metrics to determine best/worst case estimates. Metrics might be based on experience, task complexity, or some other measure of ‘risk’.
Tools can be used to analyze past projects to see how actual durations compare to the original estimates, and this information can guide future assessments of uncertainty. Consider the following analysis.
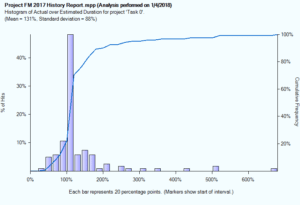
The graphic above shows a completed project which consisted of roughly 500 tasks. Forty eight percent of the tasks were actually completed close to their originally estimated duration, although we can see quite a spread of results with some tasks taking five or six times longer than their estimated duration. This may be for a variety of reasons:
- A poor estimate and the work really did take much longer than planned
- A risk/threat affecting the work occurred
- A data entry error when Actual Start/Finish were entered
- A very short duration task that overran, but didn’t really affect the outcome
Ignoring the outlying results, this information can be used to justify applying a best-case duration of say 50% of the estimated duration and a worst-case duration of say 200% of the estimated duration. The Most Likely duration is clearly the estimated duration. The shape of this histogram most closely resembles a Beta distribution, which is available in most schedule risk assessment tools.
We could have analyzed the completed project at a lower level and derived different metric values for different disciplines.
Let’s assume our sample project has similar attributes to this past project (same type of project being executed by the same team).

Above, we have applied our metric based uncertainty to all the tasks in the new project, and we are now ready to perform a schedule risk assessment/analysis (SRA). For each task/milestone in the schedule, we can expect to see results in the form of a histogram and S-Curve.
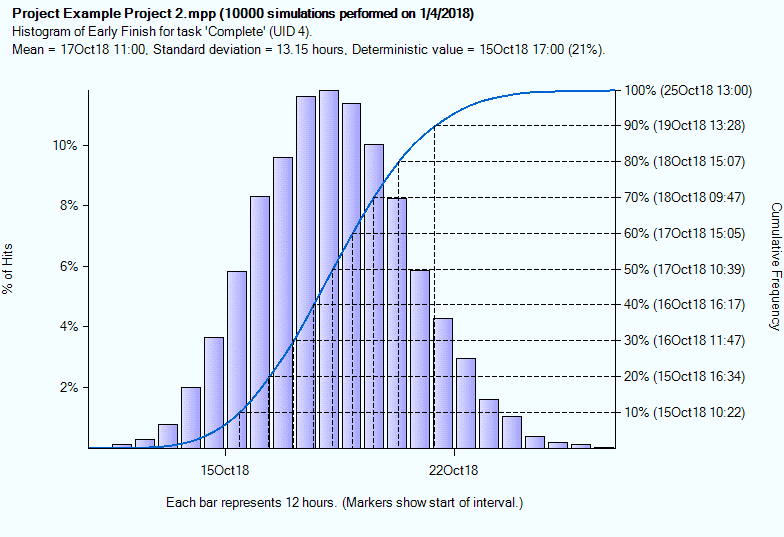
This report for the Completion milestone in our project shows that, based on the uncertainty applied to the tasks, we have just a 21% chance of completion on October 15th at 5pm. Obviously, this would be a concern, as it means we have a 79% chance of completing late.
In truth, the histogram bars are not the important element in this chart. They simply show the number of times the project is predicted to finish on a specific date/time. The S-Curve is far more important because it allows us to read off dates at a level of confidence. For example, the S-Curve (right axis) shows us we have an 80% chance of completion by 3pm on October 18th.
Why do clients request dates at, for example, an 80% level of confidence rather than 100%? The reason is due to the long thin tail to the histogram/S-Curve and because the 100% date (October 25th) is significantly later than the 80% date (October 18th). It would typically be prohibitively expensive to commit to reserve resources “just in case” the project does slip past October 18th. A few projects might justify the expense (a rocket launch with a very small viable time window or perhaps an Olympic stadium), but most do not. A 20% chance of incurring penalties is often preferable to the lost opportunity cost.
Cost Savings
So, how can schedule risk analysis actually reduce costs? Quite simply it can help predict what ‘might’ happen, which allows management to be better prepared and proactive versus reactive. There are two important techniques that help prepare managers.
The first is sensitivity analysis. This can be focused on any key deliverable and shows which tasks are creating the most uncertainty in the outcome. These may not be on the traditional critical path, but may affect specific outcomes.
The following sensitivity report (sometimes called a Tornado chart) shows us that the SW tasks are creating the most uncertainty in our deliverable.
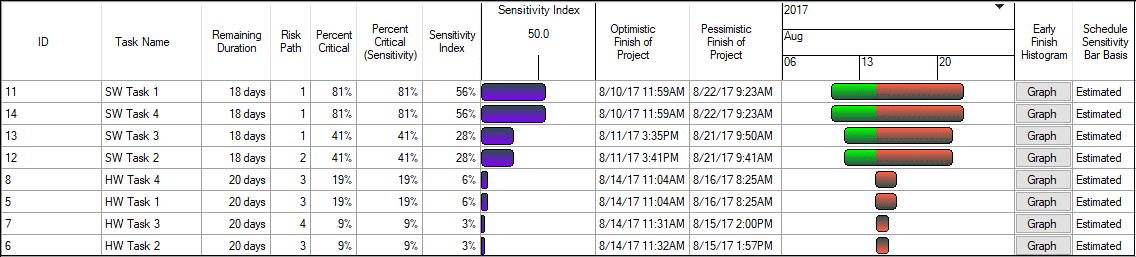
In the underlying schedule, the SW tasks were not on the critical path and yet after applying uncertainty we find that they are driving the completion date some 81% of the time. This helps the project manager focus oversight onto tasks that matter. We can also see that when the SW tasks finished early, the project tended to finish early (the green component of the bars), and this helps us identify opportunities for schedule compression.
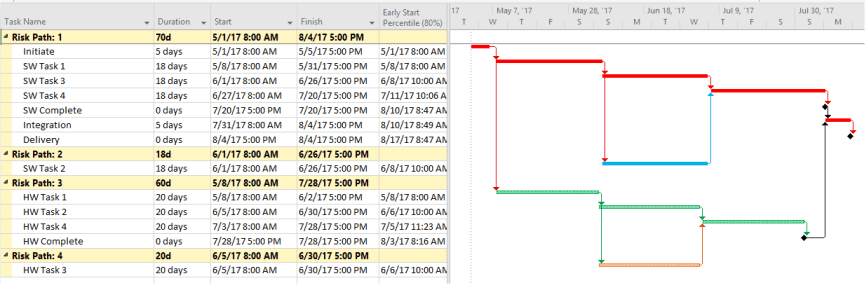
To support understanding of the reasons why tasks appear on the sensitivity chart, we can also produce a risk path analysis. This groups tasks by their importance to a selected deliverable. Again, this helps managers understand what ‘might’ happen, so they can be prepared.
Summary
Schedule risk analysis can be easily applied to any properly constructed, logic driven, schedule. Three-point estimates can be metric based, rather than based on time consuming manual estimation. The results will help reduce project management effort and improve profitability by identifying potential issues early and by providing more realistic forecasts that benefit client and contractor alike.
Related Content
Webinars (watch for free now!):
Task Planning using Microsoft Project
What’s the value of Schedule Risk Analysis?
Articles:
Levels of Project Scheduling Proficiency
Are You Using the Team Planner View Feature in Microsoft Project?
Resource Leveling: Scheduling vs. Leveling