One of the key ingredients to managing a successful project is to start off with a Microsoft Project plan that is complete and “optimized.” An “optimized” plan is a plan in which:
- Everything that is known is put into a plan that meets the overall project objectives, and
- The project delivers on the objectives of on-time, on-budget, with high quality, and a satisfied client.
Determining whether your plan is optimized can be somewhat subjective, but the minimum requisites are as follows:
- All phases, tasks, and milestones required to meet the project objectives are loaded into the work plan.
- All resources are assigned to the tasks they will perform.
- Reliable work or duration estimates are assigned to each resource assignment.
- The resources can realistically perform the work assigned according to the current estimated task start and finish dates, and all tasks can be completed by the target finish date and budget for the project.
The goal of this article is to demonstrate ways to gauge how realistic your plan is. We’ll do this by showing how to use the tools in Microsoft Project to view resource workload. The process of ensuring that resources are realistically scheduled in your work plan is referred to as “load-leveling.”
When you level the planned load for your resources, you may have to balance several factors. These include:
- The amount of work a resource can do in a time period (e.g. Hours per day),
- The sequence of tasks in the project as defined by dependencies,
- The skills required to perform particular tasks,
- The expected timeline for the project,
- The utilization rate for the resources.
Typically you will have to trade off some of these factors to arrive at the “best” schedule for your particular project. This means that you will have to check and adjust information across multiple views.
Let’s look at the most useful views and cover how each contributes to gauging the viability of your project plan.
Gantt Chart
Most managers are familiar with the Gantt Chart view, as it is the default view for most projects. The Gantt Chart is useful for getting a high level view of the project schedule and for being able to drill into the detail of a particular task. It displays some limited resource information, as shown in Figure 1:
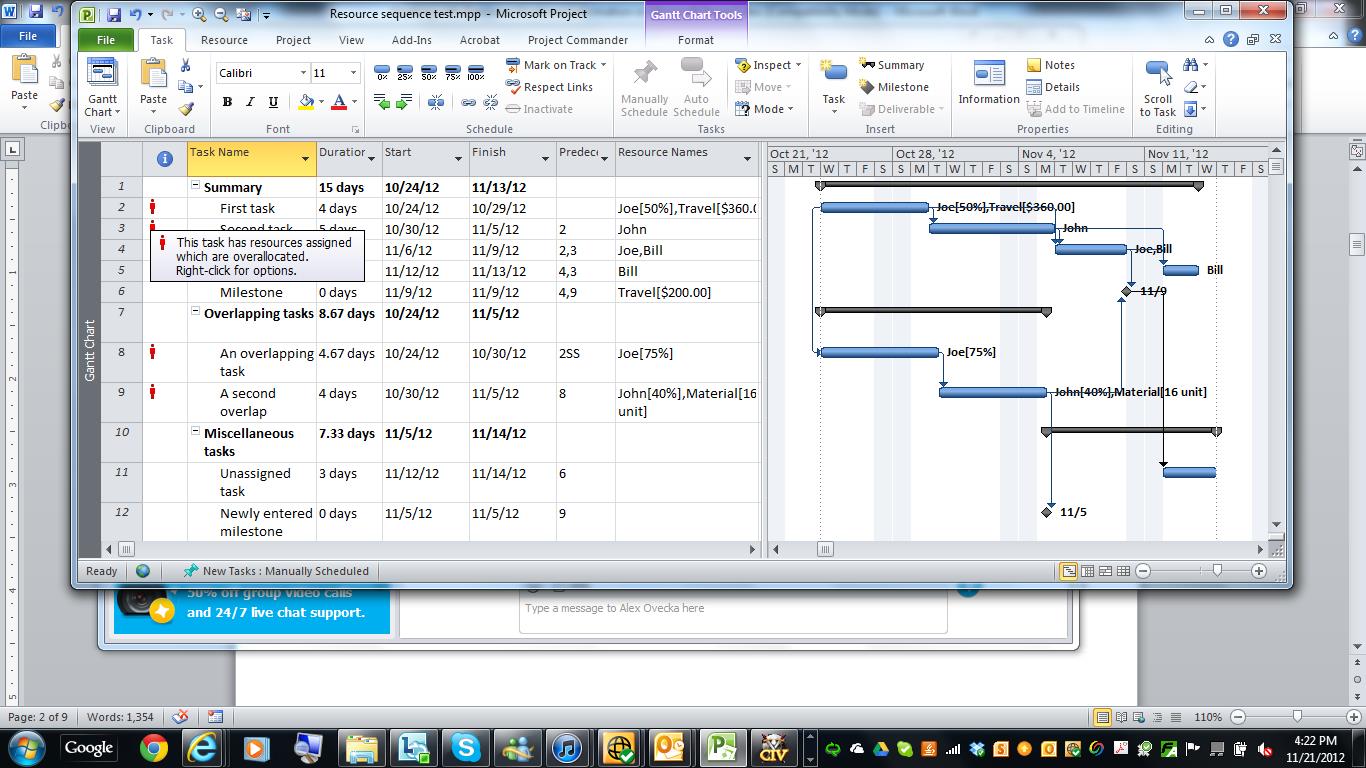
It is not suitable for resource assignment entry, but it does summarize whether there may be a problem (via the overallocated icon in the indicator column), what resources are assigned and, of course, the task schedule.
If you go to the View:Split View tab and select the Details option, you get the split screen, where the bottom half shows extra detail of the tasks selected in the top half. Next to the Details check box you just ticked, there is a drop-down list. From here, you can choose the view that is displayed in the bottom half.
By right-clicking in the bottom half of the screen, you can choose different variants of the Task Form, as seen in Figure 2.
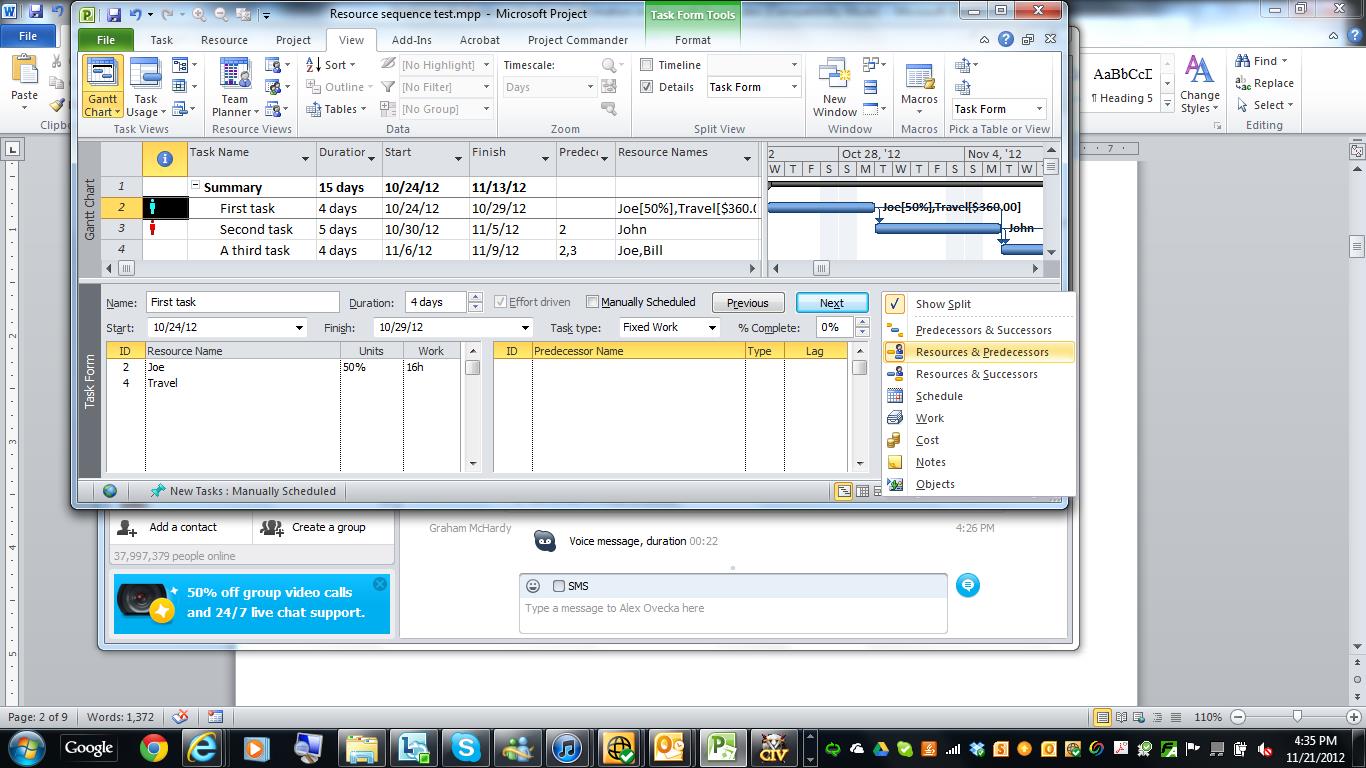
As displayed, the Task Form is very useful for entering and changing task assignments. It allows you to enter multiple resource assignments for a task with detail about either Units or Work.
Resource Usage View
The Resource Usage view is extremely useful once resources have been assigned to tasks. To get to it, you must first uncheck the Details box if it is still selected. Then, go to View:Resource Views and click Resource Usage.
This display lists the resources and, underneath each of them, the tasks to which they have been assigned. The left-hand side of the screen lists the Resources and the Task Names together with columns of total information for the resource or assignment. The right-hand side shows a time-phased view. If you right-click on this side, you can select what rows of data you would like to see in the time-phased section (see: Figure 3). As with all time-phased views, you can zoom-in or zoom-out to get a more or less detailed timescale:
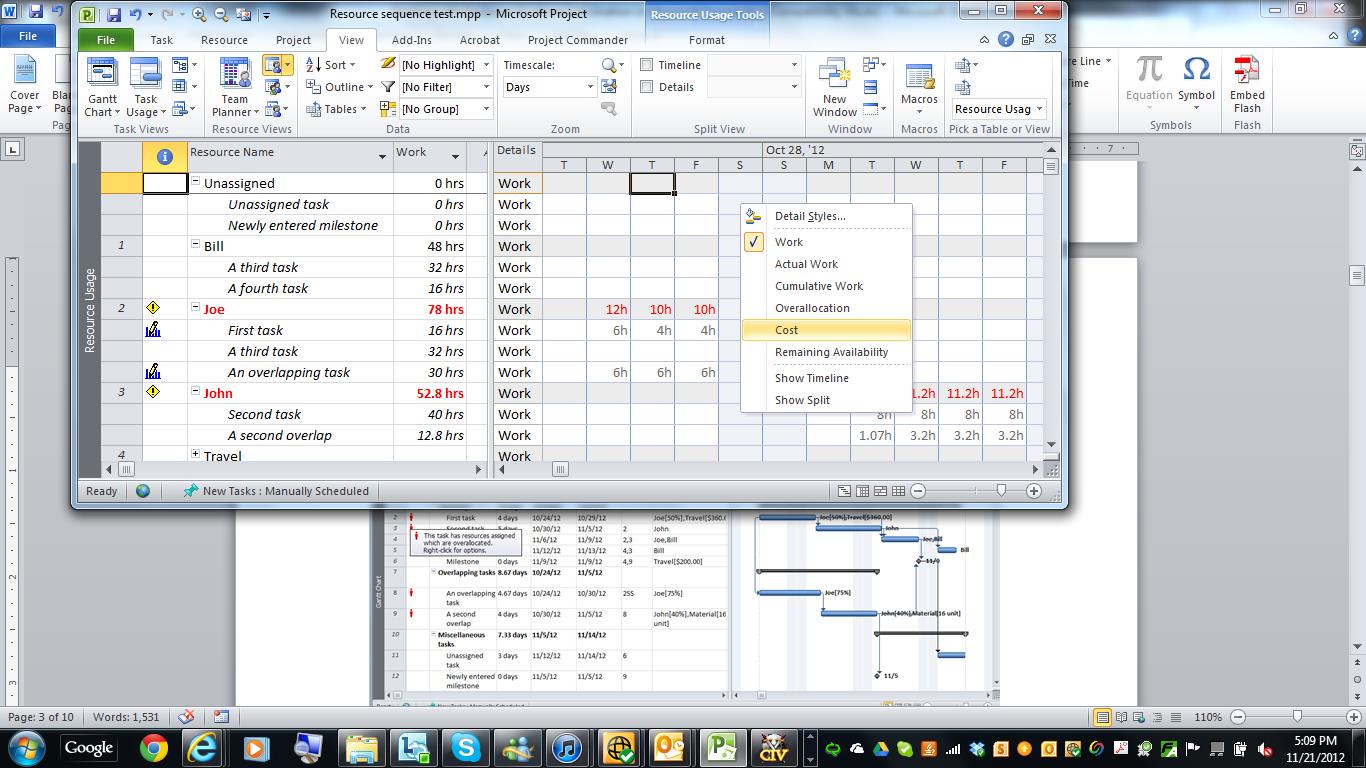
The table helps identify the resources that are overallocated and where the overallocation takes place in the project. The overallocated resources are highlighted in red and have an exclamatory icon in the indicator column. In the time-phased section, the red totals indicate which periods have a Total Workload for that resource across all assignments that exceeds the Maximum units for that resource.
The test for overallocation applies at the daily level. When you zoom-out to a weekly or monthly level of time-phased detail, the total for the period would show as red if any day within that period showed an overallocation.
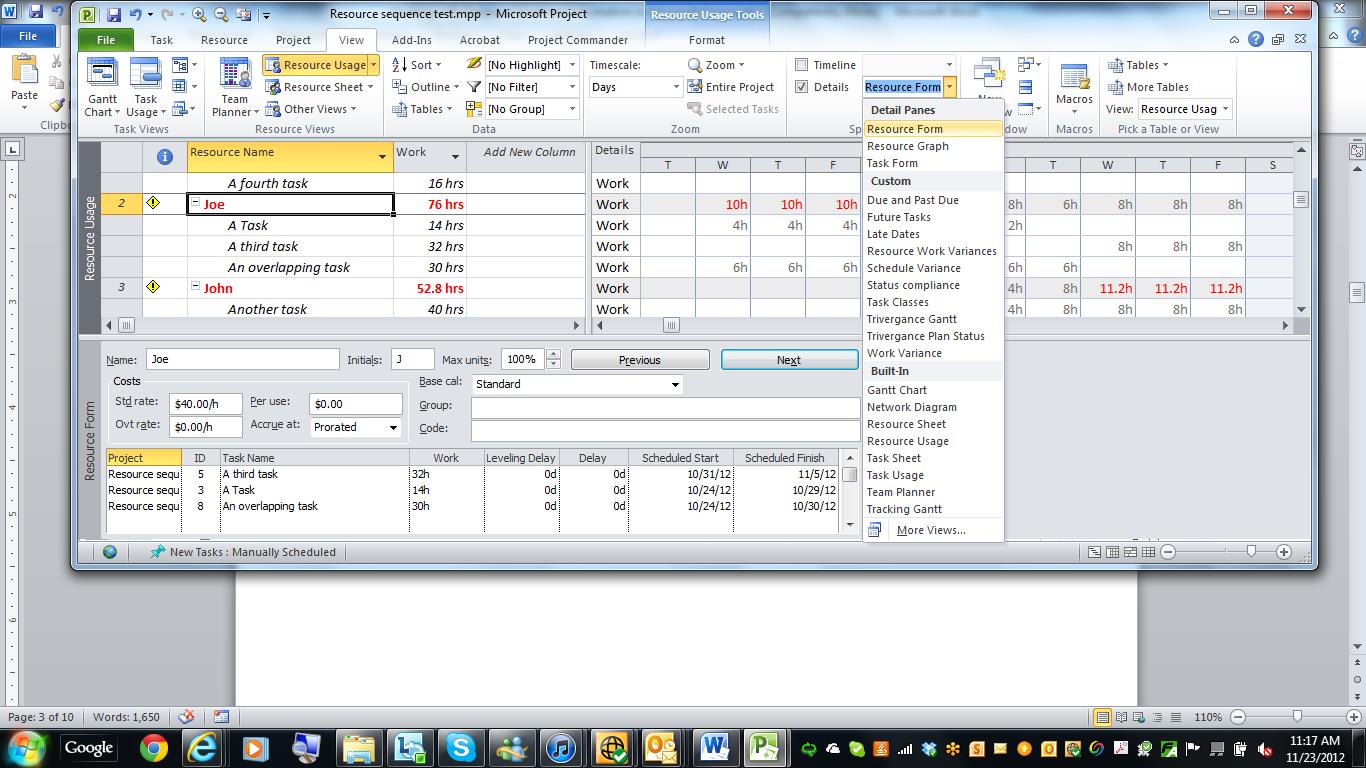
As with other views, you can select the Details option (under the View:Split Views tab on the ribbon) to display information in a split screen. For the Resource Usage view, the default for the lower pane is the Resource Form (which can have several formats), but you can select others from the Details drop-down, as seen below:
Resource Allocation View
There’s a shortcut to a particular example of the Resource Usage split screen, the Resource Allocation view. In the Vew:Resource Views tab, go to Other Views:More Views. Select “Resource Allocation,” as seen in Figure 5.
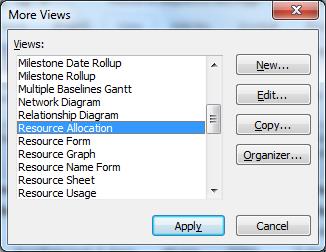
As you can see, this is similar to the split screen for the Resource Usage view, except that the lower pane shows the Leveling Gantt view. The Leveling Gantt view is particularly helpful for visualize where task slack is and, therefore, which tasks may be adjusted without impacting the project critical path.

We will see how this view is useful when we get to resource leveling.
Task Inspector
The combination of information and checks that Project carries out to display task indicators and warnings is quite complex. It takes time and experience for a Microsoft Project user to work out for themselves why each indicator or warning is being shown. In the meantime, there is a shortcut: the Task Inspector option unveils the logic that is being applied and shows you the factors being tested. On the Task:Tasks tab in the ribbon, select Inspect, as shown below:
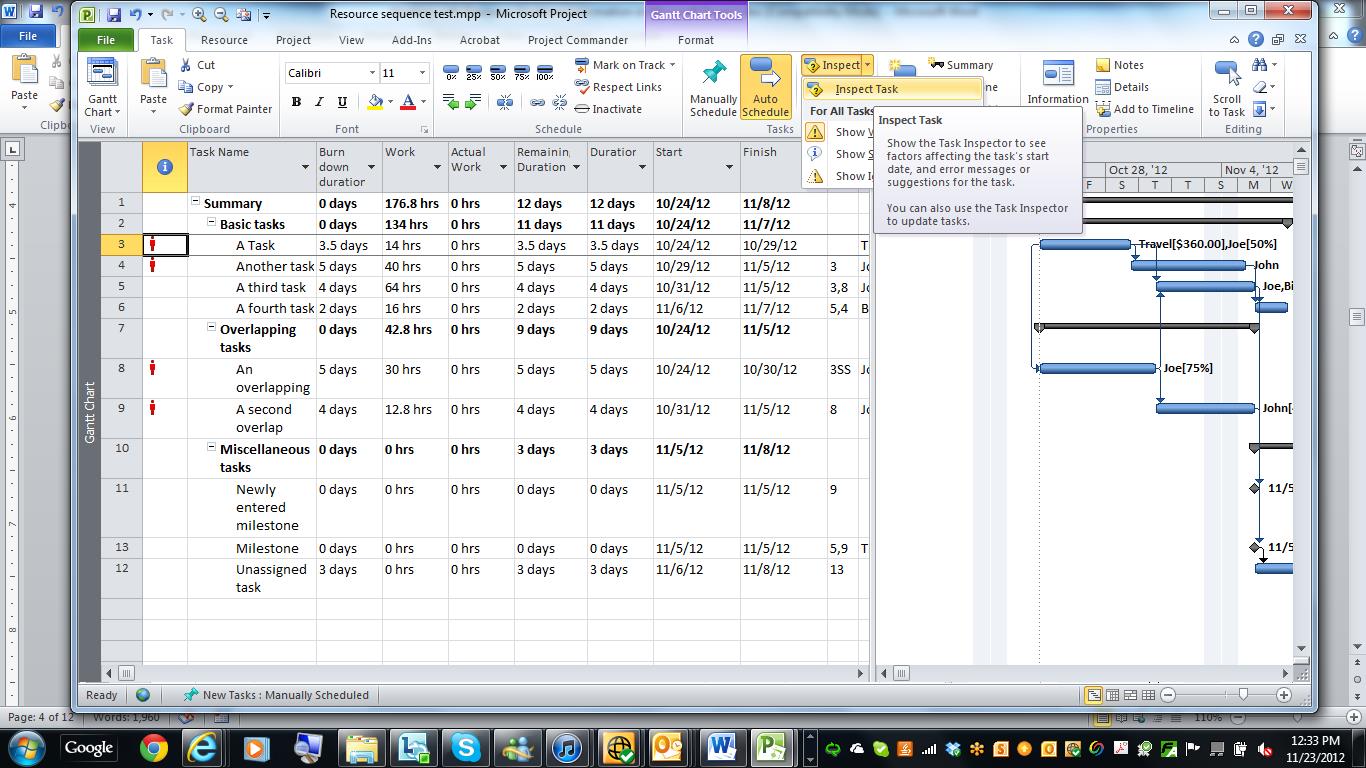
The first time you do this, there may be a couple of prompts for you to confirm the download of various ActiveX controls. You should now see a left-hand panel that summarizes key characteristics of the highlighted task:
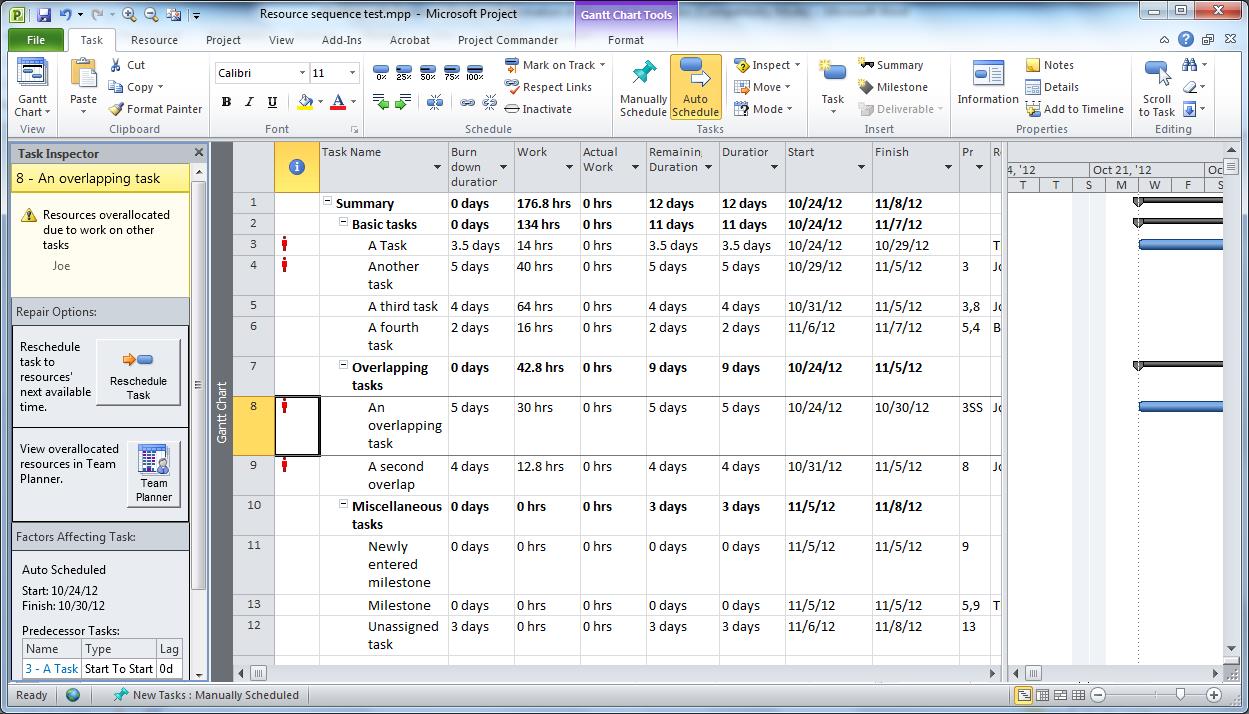
There is a section for repair options. In the case of overallocation, the options are to Reschedule Task or to view the resource in Team Planner. The Reschedule Task option is a specific case of resource leveling that we cover in the Resource Leveling section.
Team Planner
The Team Planner is a new view with Project 2010 and shows a Gantt Chart-like view of assignments per resource. There are two ways to get to the view. As was just mentioned, you can get to it from the Repair Options in the Task Indicator. More generally, though, it’s found in the Resource:View tab on the ribbon.
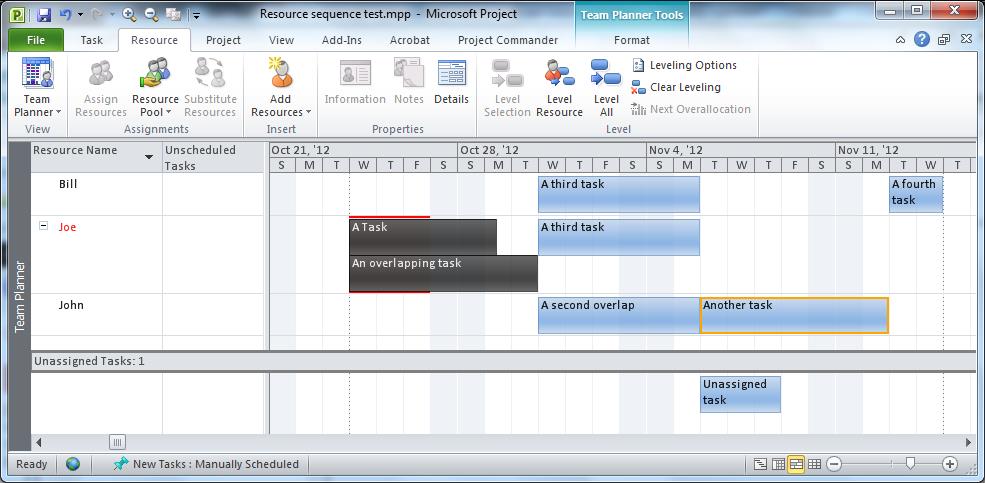
Figure 9 shows an example project in this view:
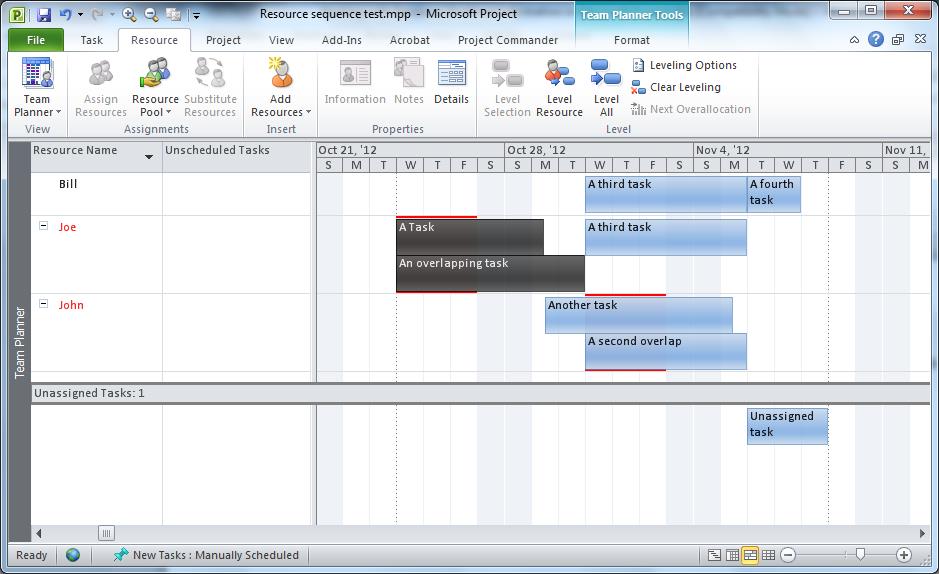
Each resource has next to them the tasks to which they are assigned, displayed along their scheduled time periods. For example: Bill is assigned to “A third task” from the middle of the week of October 28th until Monday the 4th, at which point he starts work on “A fourth task.” As with the Resource Sheet and Resource Usage views, the names of resources that are overallocated are shown in red. The assignment bars for the periods when the resources are overallocated are also outlined in red.
The Team Planner is designed so that assignment bars can be dragged on the screen. In this way, you can drag a bar from one resource to another—which changes the assigned resource—and/or you can move them from one time period to another—which will set a date constraint. The display of task assignments obeys the rules applied when the schedule is calculated. For instance, if we reschedule “Another task” by dragging it after “A second overlap,” “A fourth task” also gets rescheduled because it is dependent.
Resource Leveling
A prominent feature of Microsoft Project is the Resource Leveling function. The logic of this function depends on automatically rescheduling assignments for overallocated resources. Generally, it does this by delaying the lower priority tasks until a time when they do not cause a resource to be overallocated.
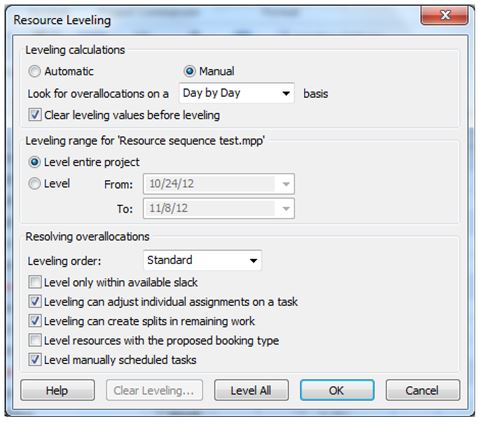
There is an entire sub-tab under Resource: Level on the ribbon to do with leveling, and there are entire chapters out there dedicated solely to applying leveling options. The Leveling Options give you an idea of the complexity of the decisions. For our purposes it is normally sufficient to accept the proposed defaults.
NOTE: It is important to realize that leveling will not adjust the resource units—that is, the number of hours a resource will work on any particular task in any particular day. If you have two tasks, each scheduled at 60% for a resource, leveling would not allow them to be scheduled simultaneously because their sum would be greater than 100%. Working on it manually, you might choose to make both assignments at 50%, but this is not an option with automatic leveling.
The Resource Allocation view is a convenient one when working with the leveling functions. Again, you get to this view, by going to the View:Resource Views tab in the ribbon and selecting Other Views: MoreViews, then selecting “Resource Allocation” from the list. Once in this view, select a resource (as Joe is in Figure 12).
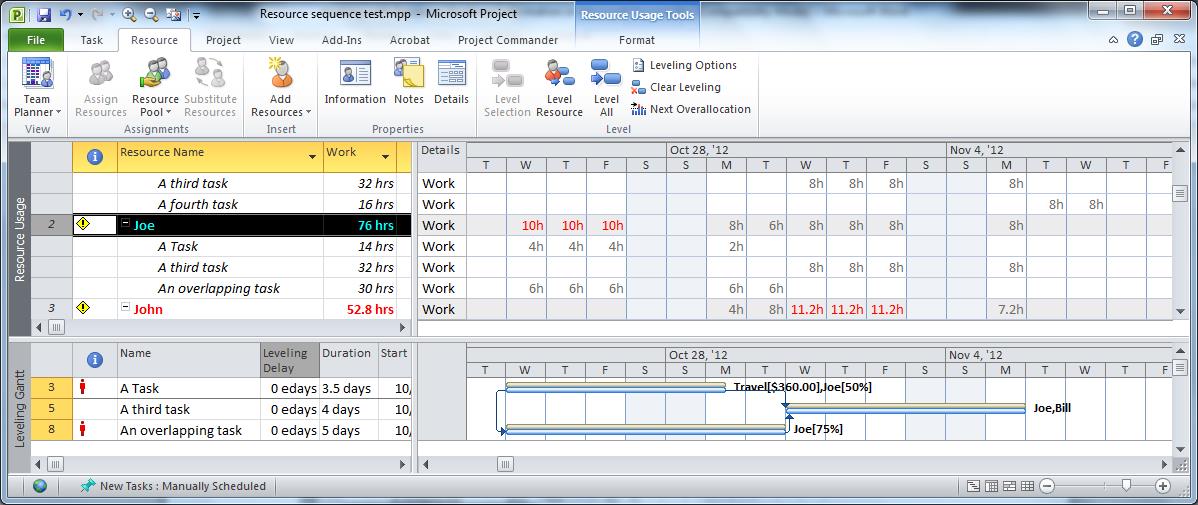
Now, click Level Resource under the Resource:Level section in the ribbon. Finally, click Level Now.
Notice the effect of choosing to level just the resource Joe. Figures 12 and 13 serve as “Before and After pictures.” In the example project, “An overlapping task” has been delayed (with a leveling delay of 5.21 edays); the dates of both “An overlapping task” and “A third task” have changed; and other project tasks dependent on “An overlapping task” have also changed.

When using automatic leveling, you need to keep a careful eye on the overall project schedule. Particularly if the box for Level only within existing slack (in the Leveling Options dialog box) is unchecked, it is easy for leveling delays to extend the project schedule dramatically. That is why it is so important that you understand the tools you have for viewing and working with Resource Allocation information.
_____________
Optimal resource management requires application of every piece of information that is known. A crucial extension of that is becoming familiar with each of the most prominent views in Microsoft Project so that you can be equipped to use each of their unique contributions. This gives you the ability to effectively gauge the viability of your project plan and to make simple adjustments to the plan that navigate around certain issues.
Copyright 2013, Gus Cicala. Right to reproduce in full is granted freely to Microsoft Project Users Group. All other rights reserved.
Related Content
Webinars (watch for free now!):
Resource Management: Maintain a Balanced Team
Resource Workload Leveling
Articles:
Resource Leveling Best Practices
3 Steps for Better Resource Management


The MPUG Community
Hi Michael – yes MPUG was given permission directly from the author (Gus Cicala from Project Assistants) to republish this great article and share it with the MPUG community. MPUG never publishes anything without the author’s permission 🙂