The article is sponsored by OnePager.
Project managers and PMOs that use Microsoft Project Desktop, Project Online, or Project Server do so because these tools offer the ability to precisely capture key project details like dates, dependencies, resourcing, and more. However, while the Project family does a great job as a Project Portfolio Management (PPM) platform, it significantly lacks reporting capabilities, especially when it comes to visuals like Gantt charts and project timelines.
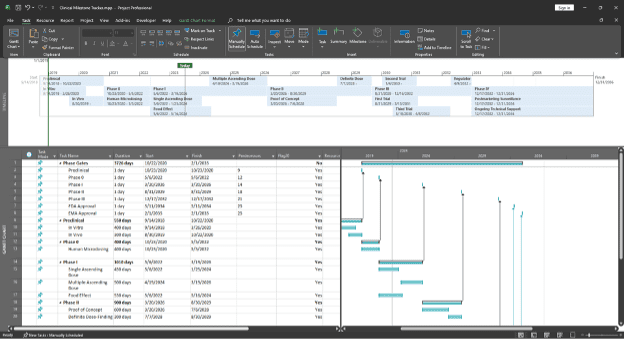
In this example from Project Desktop, the Gantt chart on the right has too much detail, and the timeline along the top doesn’t have enough:
PowerPoint: Looks Great, But No Data Integrity
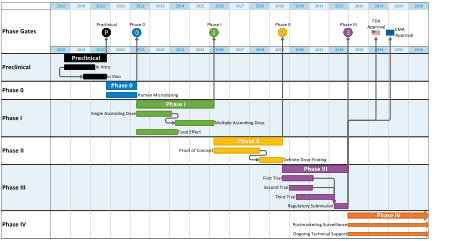
Project managers whose stakeholders and executives demand high-quality project visuals often take matters into their own hands, creating homegrown project timelines in tools like PowerPoint or Visio.
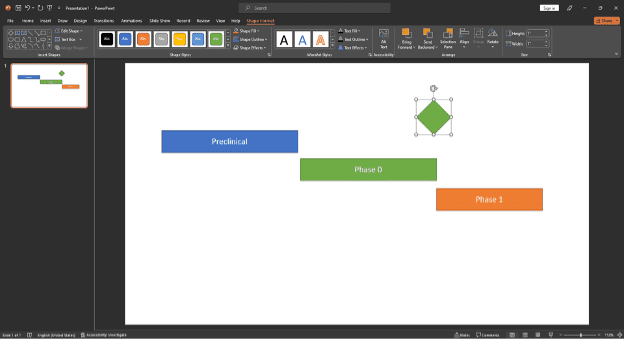
These charts may look ok, but beware that they’re really a trap:
- PowerPoint charts aren’t guaranteed to be accurate because they weren’t generated from the original Microsoft Project data.
- PowerPoint charts are almost immediately out of date. Every time the project changes, the PM needs to rebuilt the chart by hand.
As soon as you build a chart in PowerPoint, your management team is likely to ask you to build more charts in PowerPoint, which quickly snowballs into a massive commitment with no end in sight. In fact, our research shows that the average project manager spends four hours per week building and maintaining project reports. Multiply those four hours by the number of weeks in the year, and then again by the number of PMs in a PMO, and you’ll quickly get to a number that’s unsustainable.
Not only does this represent a lot of wasted time, but the hand-built nature of the charts means that there is no guarantee that any of the visuals are even remotely accurate. We’ve heard stories of PMs who built timelines by hand, placed a milestone on the wrong date, and didn’t catch it until they were presenting in front of their senior management team—talk about not having much to show for your efforts!
OnePager: Data-Driven Timelines from Project in Minutes, Not Hours
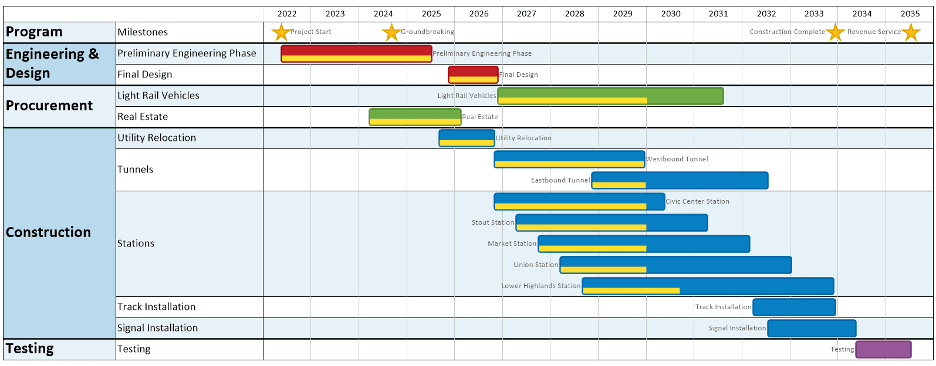
OnePager Pro gives project managers the best of both worlds: timelines and Gantt charts that look right at home in PowerPoint but are built dynamically using the data in Microsoft Project, giving you 100% confidence in the accuracy of what you are presenting. OnePager imports one or multiple projects from Microsoft Project Desktop, Project Online, or Project Server, and from those imports, will create a project timeline or Gantt chart in a matter of only a few seconds. From there, you can easily change colors, swimlanes, and other settings to fine-tune the look of your chart:
When you’re happy with the look of your chart, you can save it to PowerPoint or as a PDF file. What’s even better is that as your plan changes back in Project, you can easily open your chart in OnePager, click a button to refresh it, and quickly get an updated view of your timeline without having to build it again from the ground up.
What OnePager Pro Offers
At a very basic level, OnePager Pro gives you the ability to create data-driven project timelines and Gantt charts using the data that you already have in Project. At a deeper level, you’ll find that OnePager’s tight integration with Project offers a number of key features, including:
- Seamless Import: OnePager supports Microsoft Project desktop (*.mpp) files, in addition to pulling projects directly from either Project Online or Project Server.
- Multi-Project Reporting: OnePager can quickly combine separate project plans into a portfolio-level view.
- Gantt and Timeline Layouts: OnePager makes it easy to switch between a Gantt chart (waterfall) and a timeline (birds-on-a-wire) chart, depending on the layout your team requires.
- Swimlanes: OnePager uses the WBS or any other field from Project to effortlessly group and sort tasks into swimlanes. For more complex projects, up to three levels of nested sub-swimlanes are available.
- Conditional Formatting: OnePager’s patented conditional formatting engine makes it easy to control the color, shape, and style of the tasks and milestones in your chart, all based on the data in Project. This is more efficient and more accurate than formatting by hand.
- Data Display: Depending on your audience, you can ask OnePager to display key project data like percent complete, baselines, critical path, or dependencies. For simpler projects, quickly turn this information off for a higher-level view.
- One-Click Update: As your project plan changes, OnePager can update your chart in a single button click, ensuring that your timeline is always in sync with the latest version of your project.
- Change Tracking: With each refresh of your chart, OnePager can track changes over time, giving you a visual history of how your project has evolved.
To learn more about OnePager Pro and how it will work with your existing Microsoft Project plans, sign up for a free trial license, or reach out to sales@onepager.com for more information.