Articles

This meme is funny because it shows a cargo ship on fire with the text "PROJECT IS IN GREAT SHAPE" above it, and "PARTS ARE SHIPPED" below it. This is a metaphor for a project that is in a lot of trouble, but the parts have already been shipped, so it's too late to turn back.

Identify and Respond to Black Swans

Discover proactive strategies, 10 key steps for identification, and actionable measures to fortify projects against unforeseen challenges.

" A proximity map is a visual representation of the people involved in a particular situation, and their relative influence. The map is divided into three concentric circles. The inner circle represents the people who are most directly involved in the situation, and the outer circle represents the people who are least involved. The people in the middle circle are those who are somewhat involved. The lines between the circles represent the strength of the relationships between the people. The thicker lines represent stronger relationships, and the thinner lines represent weaker relationships. The proximity map can be used to identify the people who are most likely to be influenced by a particular message or campaign. It can also be used to identify the people who are most likely to resist change. Here are some tips for using a proximity map: * Use it to identify the key players in a situation. * Use it to understand the relationships between the people involved. * Use it to identify the people who are most likely to be influenced by a particular message or campaign. * Use it to identify the people who are most likely to resist change. * Use it to develop strategies for influencing people. Proximity maps are a valuable tool for understanding the dynamics of a particular situation and for developing strategies for influence."

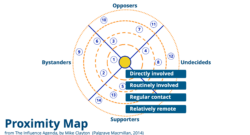
How Many of These 8 Stakeholder Analysis Tools Do You Know?

Explore essential stakeholder analysis tools with Dr. Mike Clayton as he unveils his top eight favorites for effective project management.

This is a traffic sign that indicates a horse-drawn carriage is crossing the road.

Webinar: Five Must-Knows to Be A PMI Portfolio Management Professional (PfMP)

Join our webinar on PfMP certification – your path to career growth. Learn the value of PfMP, explore exam domains, and discover the top five must-knows to become a PMI-PfMP. Elevate your portfolio ma...

Image illustrates project management is a challenging field, but it can also be a lot of fun. However, there are some aspects of project management that can be downright spooky.

The Spooky Side of Project Management

Explore the eerie parallels between Halloween and Project Management. Learn to adapt, conquer past mistakes, and tackle recurring issues. Embrace the project spirit this October and enjoy a Spook-tacu...

A women consulting with another women at a table

Too Much to Do? Here’s How to Talk to Your Boss About Your Workload

Learn how to discuss your overwhelming workload with your boss in 7 simple steps. Take control, set priorities, and reduce stress for a more manageable work life.

In this image, there is a product backlog, sprint backlog, in test, demonstration, and completed. The product backlog is a list of all the features that need to be built for the product. The sprint backlog is a list of the features that will be built in the next sprint. The in-test column is where the features are being tested. The demonstration column is where the features are being demonstrated to the customer. The completed column is where the features that have been completed and accepted by the customer.

Streamlining Success: Lean Principles in Project Management

Discover the power of Lean project management in reducing project waste, optimizing workflows, and achieving customer-centric excellence.

Harnessing the Power of Excel’s Power Pivot for Multiple Data Sets

Excel struggles with pivot tables from multiple data sets. Power Pivot offers a solution by integrating data sets within a dedicated storage area. Learn how to activate Power Pivot, build a data model...

This graph shows the planned value (PV), earned value (EV), and actual cost (AC) of a project over time. The PV is the amount of money that was budgeted for the project, the EV is the amount of money that has been earned by the project, and the AC is the amount of money that has been spent on the project.

The graph shows that the project is currently behind schedule and over budget. The PV is higher than the EV, which means that the project is not earning money as quickly as it is spending money. The AC is also higher than the EV, which means that the project is spending more money than it is earning.

The project is currently in a negative cash flow situation, which means that it is spending more money than it is earning. This is a serious problem, and if it continues, the project will eventually run out of money.

The project manager needs to take immediate action to address the problems that are causing the project to be behind schedule and over budget. If the project manager does not take action, the project will likely fail.

Earned Value Management (EVM): Monitoring Project Performance and Forecasting the Future

Explore the nuances of Earned Value Management (EVM) through the lens of the XYZ project. Learn how EVM serves as a diagnostic compass in project management, helping to assess past performances and in...

Image illustrates a A virtual meeting meeting that takes place online, typically using video conferencing software. Virtual meetings can be used for a variety of purposes, such as team collaboration, customer presentations, and training sessions

Communication is the Key: Unlocking Doors with Effective Communication

Unlock the potential of your team through effective communication. Explore its effects on efficiency, team dynamics, and organizational success.