Please find below highlights from Ben Howard’s Webinar: Power BI for Business Users and Project Managers (3 of 3) on how to use Power BI to automate your reporting process and have more time to do what you really enjoy – Project Management! This highlight article is being provided by MPUG for the convenience of our members. You may wish to use this transcript for the purposes of self-paced learning, searching for specific information, and/or performing a quick review of webinar content. There may be exclusions, such as those steps included in product demonstrations or there may be additions to further explain topics. You may watch the live recording of this webinar at your convenience.
As we have discussed in our previous articles, Power BI is a powerful data visualization tool that allows users to easily create stunning reports and dashboards. In the previous article, we covered how to import data into Power BI using Power Query, and how to apply filters to only view relevant data. In this webinar recap, we will look at the process of transforming raw data into an informative and visually appealing Power BI report.
So, what can we do with Power BI? Well, first of all, it’s important to know that we have a canvas or a report. I’m highlighting the report, which is a page. Think of it as similar to a PowerPoint page, but with interactivity. That report or page has visualizations on it. The visualizations we can put on the page include bar charts, column charts, donut charts, slicers, and text boxes. I can also change the look and feel of all of these things to give my report a nice, branded appearance. If I have multiple pages, I can rename them as well. Let’s have a look at what we’re going to do.
Formatting a Report in Power BI
Often when I start a report, I’ll have an understanding of somebody’s branding requirements. In fact, I will ask for it. “What does your company’s branding look like?” You can spend forever branding, but for now, I have not prepared anything for this. My report will not be as nicely branded as it could be, but the main focus today is on how to get data into Power BI and how to publish it. Once we’ve covered that, I can spend the next two days fine-tuning the report to make sure the colors are correct, etc.
Creating a Background in Power BI
To begin formatting a report in Power BI, you can start by deciding whether you want to have a background on the report page. You can do this by clicking on the format button, which is the one with the paintbrush. I’ll select a plain background. Alternatively, you can use an image if you prefer, but keep in mind that it might distract from the data in the report.
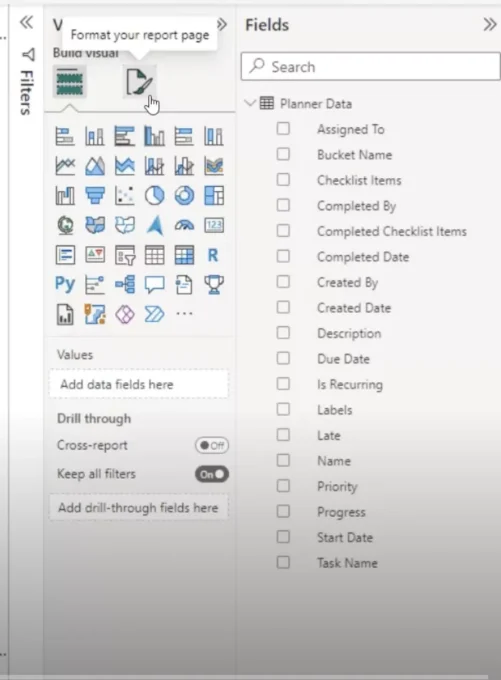
Then, you can go to the canvas background and choose a color or image. A neat trick is to make the background transparent, which will help line up the visualizations on the page.
Adding a Text Box
To add a text box with a label, click on the “Add Text Box” button and type in the desired label, such as “Planner Report from Sharepoint.” You can then adjust the font, size, and color of the text by using the formatting options available. For example, you can change the font to Arial, the size to 12, and the color to white.

To change the background of the visualization, navigate to the formatting toolbar with the textbox selected, and type “Background” in the search field. This will bring up the option to change the background color as well as other formatting options, like changing transparency.
Importing Data Fields into Power BI
Now you may want to filter your data by report name. To do this, click and drag the “Name” field from your data onto the report.
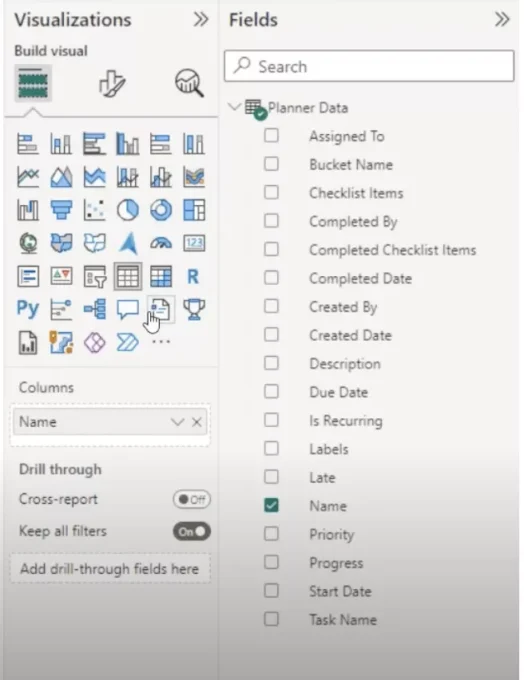
When you drag the “Name” field onto the report, it will automatically create a default visualization, which is a table. This table will list all the names of your projects or planner names that you brought into the report.

You can see that the “Name” field is a textual field, so the default visualization for this type of data is a table. The table has been highlighted, and it’s a list of tables or a list of projects. This is a good starting point to begin analyzing your data.
Creating a Slicer to Filter Field Names
Slices are visualizations that allow you to filter data. These slices, also known as slicers, work similarly to filters in Excel, and are a nice way to select data. To add a slicer, you can drag a field, such as a name, into the visualization area. Once the slicer is selected, you can format it and add different fields. However, some analytical features may not be available for slicers.
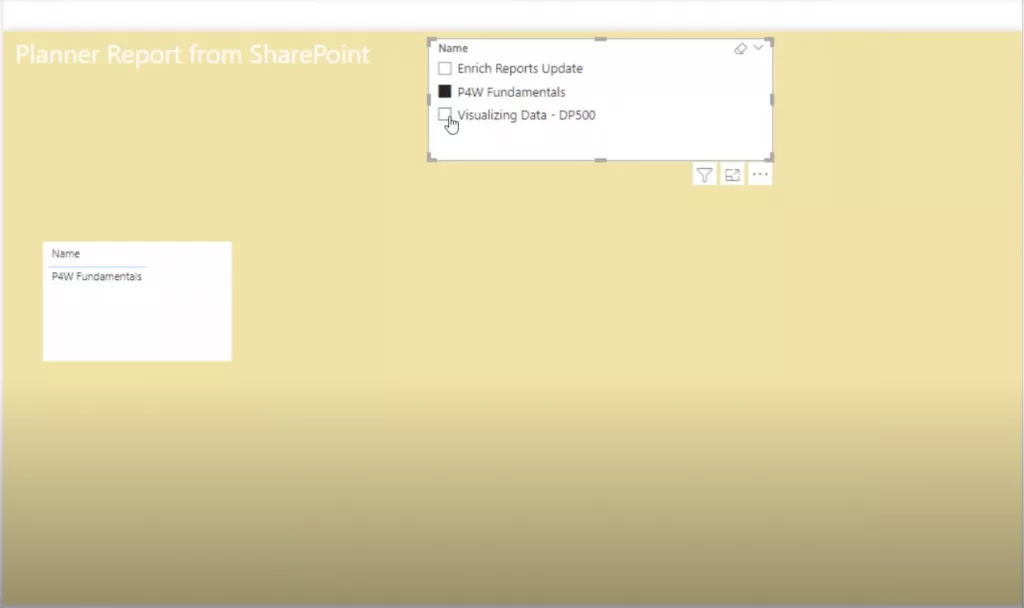
Additionally, you can use the slicer to filter other visualizations. For example, if you select “P4W Fundamentals” in the name slicer, it will filter the other visualizations to only show data related to “P4W Fundamentals.” You can also multi-select by holding down the control key while clicking on multiple items in the slicer. This is how Power BI works, with interactivity between different visualizations.
Changing the Properties of a Slicer in Power BI
To change the properties of a slicer in Power BI, select the slicer and go to the properties. One property you can change is the style of the slicer. You can change it to a drop-down list by selecting format slicer settings options.

Additionally, you can also format the slicer by going to the general properties or effects. For example, you can change the background to 100% transparent, or change the font color of the text and values to white.

However, be aware that if the text color and values color are the same, it could be hard to read. I will not be spending too much time on formatting, but showing you how to change the slicer style to a drop-down list, and how to change the font color for the text and values.

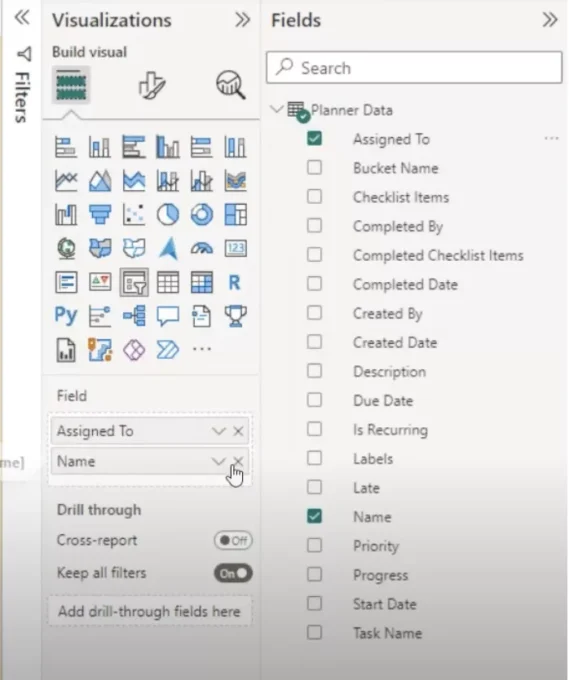
Now that you have a slicer to filter the reports by name field, you might want to include a field to filter tasks by assigned by fields. To do this, just copy the slicer and drag the “Assigned to” text field in the the field section and delete the “Name” text field.
Building a Donut Chart in Power BI
In Power BI, to create a donut chart, you will first need to select the donut chart option in the visualization pane and add it to your report. In this example, the outside piece of the donut chart represents the total number of tasks by status, and the middle piece represents the number of tasks that are not started.
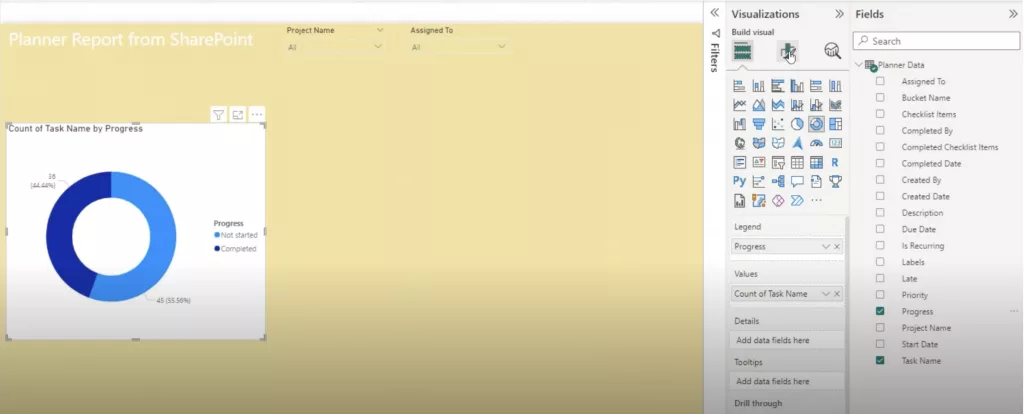
To customize the chart, you will need to add the task name as the values and use the distinct count to ensure that duplicate tasks are not included. You can also add a status column to the legend to split the chart by different statuses. To ensure that the data is accurate, you can also check the data view to see the number of rows and distinct values in the task name column.
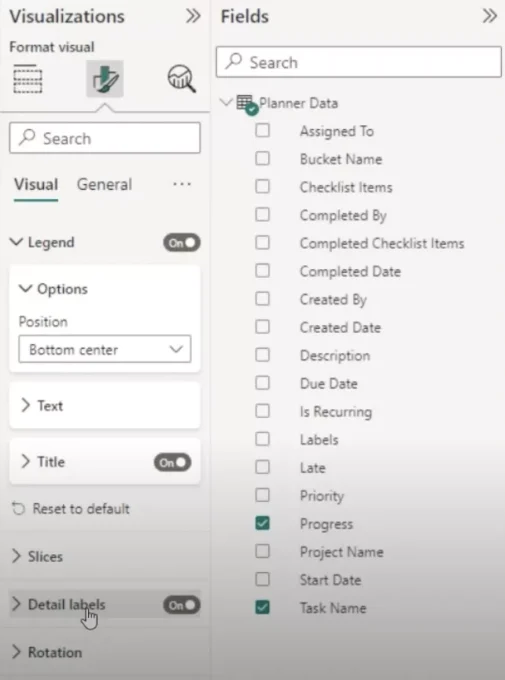
Once you have added your data to the donut chart, you can customize the chart by making changes to the legend. You can position the legend in different locations, such as bottom center. You can also customize the title of the chart by going to the general settings and turning it off if you do not want it to be displayed.
You can also customize the look of your donut chart by adding some effects. One option is to make the chart completely transparent so that it blends into the background. Another option is to add a border around the chart.
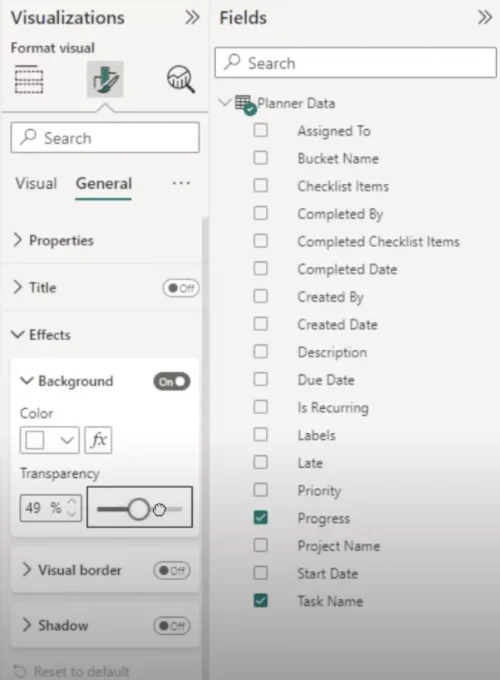
This can be done by going to the effects option and selecting visual border. You can also add a shadow to the chart to make it stand out more from the background. This will create a 3D effect and will make the chart more visible. These are some of the ways to customize the look of your donut chart in Power BI.
Displaying a Card with a Single Value in Power BI
As a project manager, you may want to display a single value, such as the number of tasks that are not started, because it provides a quick and easy way to see a specific data point without having to dig into the details of the chart. The card can be used as a quick reference point to see the exact number of tasks that are not started, which can be important for a project manager to know.
- Add a card to the report by selecting it from the visualization pane.
- In the card’s field well, add the “Task Name” column.
- Change the aggregation of the Task Name from “count” to “distinct count”.
- In the filter pane, drag the “Progress” column into the filter box for the card.
- In the filter, select “Not started” as the filter criteria.
- The card will now display the distinct count of all the tasks that have the “Not started” status.
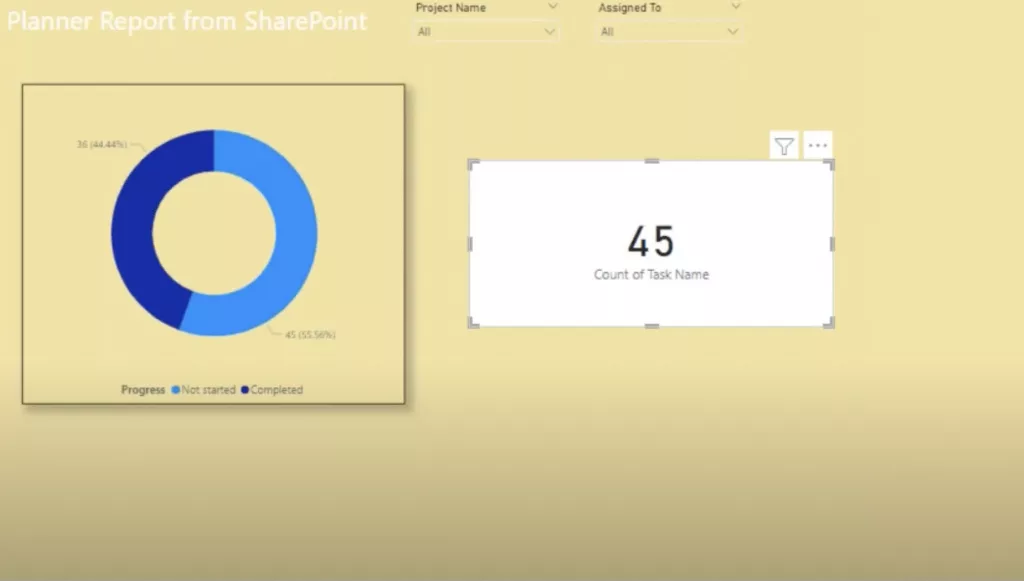
You can also use this card as a title for your Donut Chart by changing the background of your title to transparent and changing the title of your data source. To do this you can simply click on the field tab.
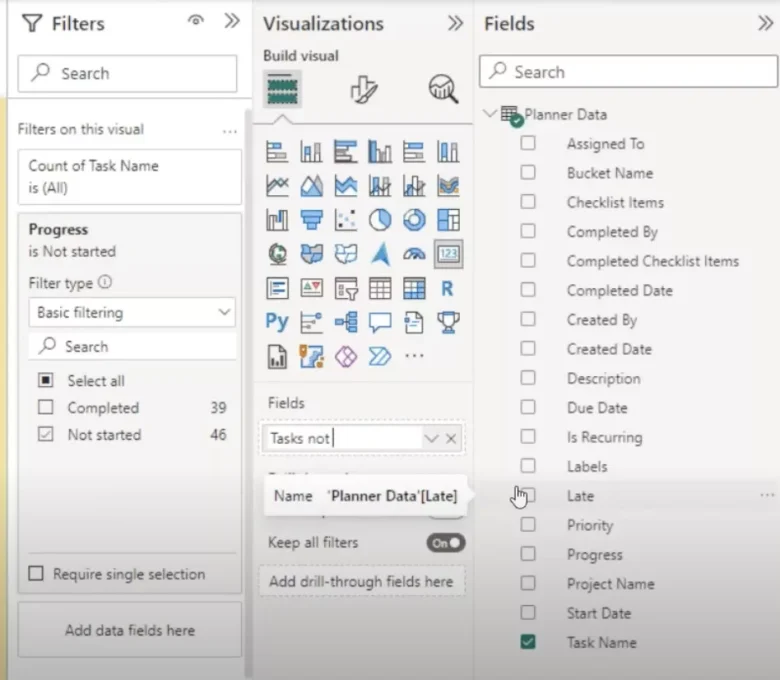
Now you can drag your card with its new title and transparent background into the center of your donut chart.

Yes, that’s correct. In Power BI, you can also adjust the radius of your donut chart by updating the “spacing” in the slicer’s formatting tab. This will allow you to control the distance between the inner and outer parts of the chart, and make the chart more or less compact.
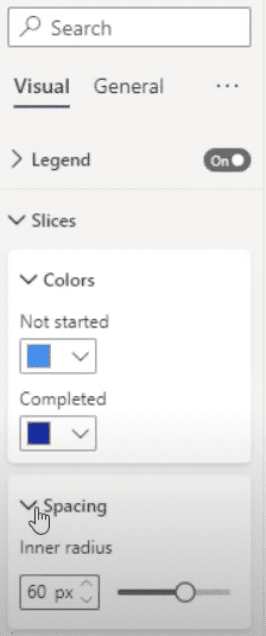
There are several other formatting options that you can do on a donut chart in Power BI:
- Color: You can change the color of the slices in the donut chart. You can use a single color for all the slices, or you can use different colors to represent different statuses.
- Label: You can add labels to the slices of the donut chart. This will display the name of the data point and its value. You can also adjust the font, color, and size of the labels.
- Tooltip: You can add a tooltip to the donut chart. This will display additional information about the data point when the mouse is hovered over it.
- Animation: You can add animation to the donut chart. This will make the chart more interactive and make it easier to understand the data.
Adding a Stacked Column Chart in Power BI
As a Project Manager, you may want to add a stacked column chart to visualize and compare the distribution of data across different categories. It is a useful tool to show how different parts contribute to the whole.
To add a stacked column chart in Power BI, select the stacked column chart from the visualization pane and add it to the report.
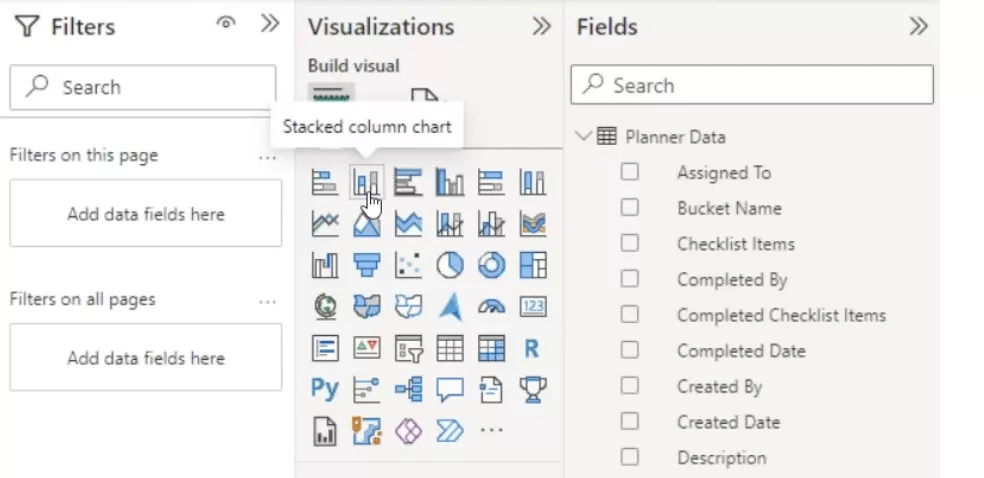
Then drag the “Bucket Name” column to the X-axis and the “Number of Tasks” column to the Y-axis. This will create a stacked column chart that shows the number of tasks by bucket name.
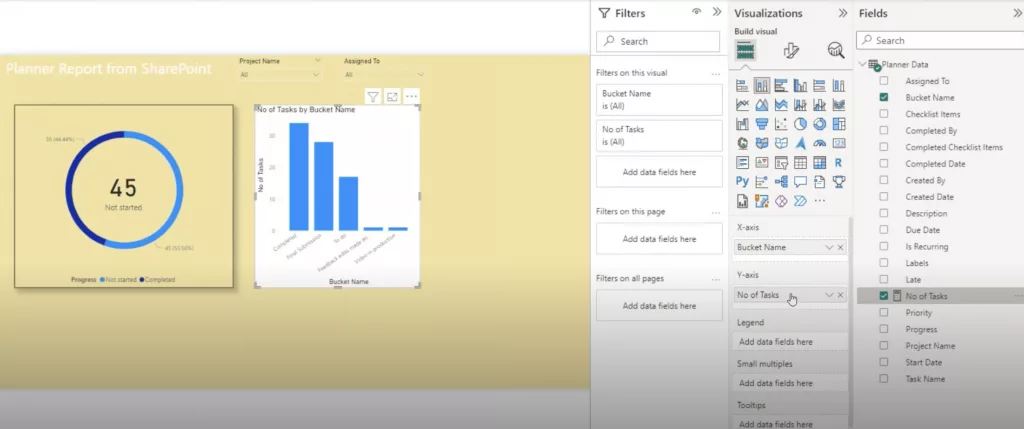
You can then sort the X-axis by “Bucket Name” alphabetically in ascending order to ensure the buckets are in alphabetical order.
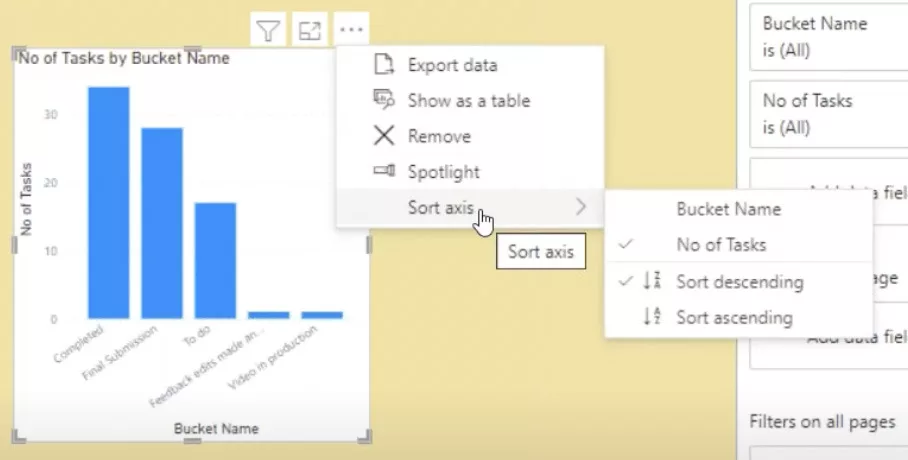
You can also change the formatting of the chart by adjusting the transparency, adding a shadow, and adding a visual border. This will make the chart more visually appealing and easy to understand.
Publishing and Sharing your Report in Power BI
When you are ready to share your Power BI report with others, you can publish it to the Power BI service. This will allow users to access the report on the web and view the data in real-time.
Before publishing, you can hide the filters to prevent users from changing the data in the report.
When you publish a report, you need to choose where you want to publish it. You can publish it to a workspace in the Power BI service. It’s important to note that the user Juliet needs to be added as a member to the workspace where you want to publish the report, otherwise she won’t be able to access the report.
You can also set up automatic refresh for the report, so that the data is updated on a regular basis. This ensures that the users are viewing the most up-to-date information.
Finally, if you want to share the report with a specific group of people, you can embed the report into a Team channel in Microsoft Teams. This will make it easy for team members to access and view the report.
Setting Up Scheduled Data Refresh in Power BI
When you publish a report to the Power BI service, you can set up scheduled refresh for the data set. Scheduled refresh allows you to automatically update the data in your report on a regular basis, ensuring that users are viewing the most up-to-date information.
To set up scheduled refresh, you need to go to the dataset settings in the Power BI service, and select “Scheduled Refresh.”

You will be prompted to configure the data source credentials, which is necessary for the data refresh. If you are using an organizational privacy setting, you’ll need to use an organizational account to refresh the data.
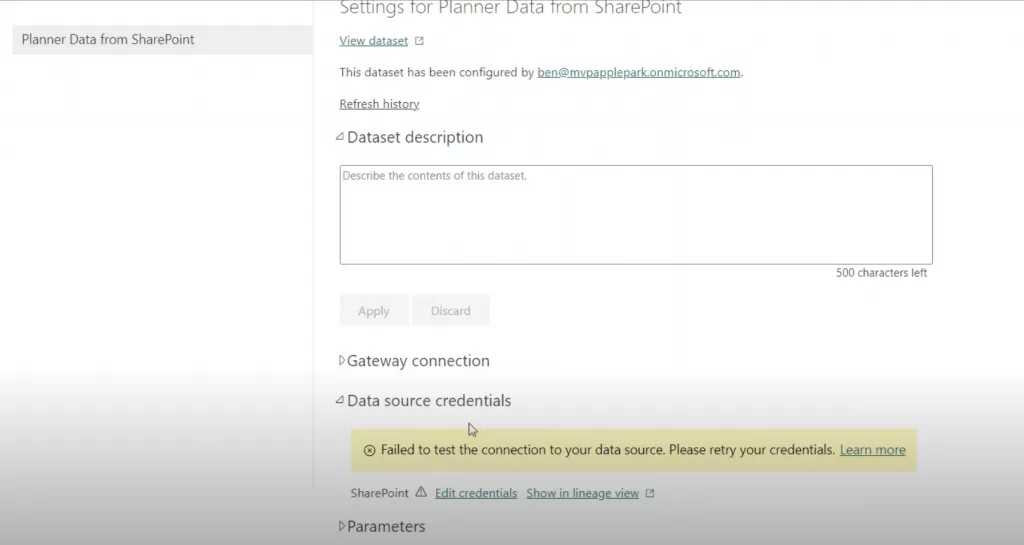
Once you’ve set up the credentials, you can configure the refresh schedule. You can choose to refresh the data daily, or if you have a Pro license, up to eight times a day. You can also set specific times for the refresh to occur. For example, you can set the refresh to happen at 10am every day.
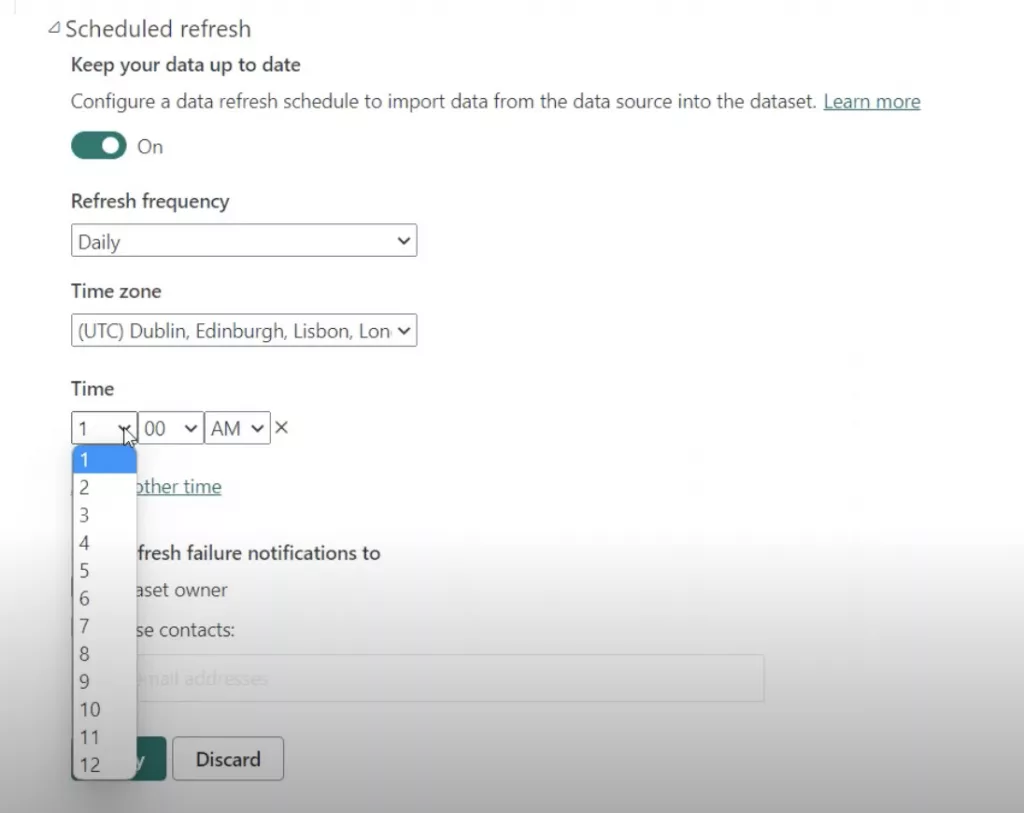
It’s important to note that the refresh schedule will depend on the size of the data set and the number of users accessing the report. It’s important to choose a schedule that meets the needs of the users while minimizing the impact on performance.
You can also manually force a refresh of the data in Power BI, in case you need to update the data immediately. To do this, you can go to the dataset settings in the Power BI service, and select “Refresh Now”. This will manually trigger a refresh of the data, updating the report with the most recent information

Conclusion
In conclusion, Power BI is a powerful tool that can help project managers automate their project reports. By using Power BI, project managers can easily connect to various data sources, create and customize visualizations, and share the reports with their team members. With the help of this tutorial, you have learned how to create a donut chart, stacked column chart, filters, measures, and how to set up scheduled refresh for a data set in Power BI. This tutorial also explained how to publish the report and share it with the users, set up the refresh for the data set, and how to manually trigger a refresh of the data in case it is needed. By using Power BI, project managers can easily analyze and present their data in a clear and concise manner, helping them to make better decisions and keep their projects on track.


