Project schedules are concerned with the future. A project schedule is, in effect, a projection or forecast of how and when the project will be performed. This projection is typically made using the critical path method (CPM), which means that the projected dates are based upon the estimated durations of the various tasks and the logical dependencies between them.
The critical word in the above is “estimated.” The durations that we put into our CPM model are just estimates or predictions. And as Niels Bohr, Yogi Berra, or Samuel Goldwyn (depending on who you ask) once may have pronounced, “Prediction is very difficult, especially about the future.” Everything we think we know about the future is subject to uncertainty, and duration estimates are no exception. The amount of uncertainty varies, depending upon how much the current project resembles previous ones, how much relevant historical data we have, and so on. But we can be certain that there is some uncertainty. Recognition of this fact is essential to creating realistic project plans.
The way we recognize uncertainty about task durations is to replace single-point estimates with a range of possible values. For example, instead of saying a task will take five days, we say it will take somewhere between three and eight days. Often this will be augmented by giving a “most likely” value, in this case maybe five days.
This two- or three-point estimate may be further refined by specifying the shape of a probability distribution to represent the data. Historically, this has included a subset of the beta distribution sometimes called beta-PERT, though there is no particular reason to favor this. In fact, there is some empirical evidence to suggest that the lognormal distribution is more appropriate.
What About PERT?
Developed by the US Navy in the 1950s to manage the Polaris missile program, PERT (Program Evaluation and Review Technique) was an early attempt to incorporate uncertainty into the project schedule. It was based upon the assumption that task durations had a beta-PERT distribution represented by three parameters — the optimistic value A, the most likely value B, and the pessimistic value C — and that this resulted in a mean of (A+4B+C)/6 and a standard deviation of (C-A)/6, though both of these are approximations.
Having made these approximations, PERT pretty much forgets about uncertainty. It performs a CPM calculation based upon the mean values of the durations given by the above formula. This isn’t very different from doing a deterministic CPM based upon the most likely value B. In the symmetrical case, where B = (A+C)/2, it is no different at all.
The above procedure produces an estimate of the expected finish date, and this is augmented by an estimate of the standard error of the estimate based upon the fact that variances are additive. The variance is the square of the standard deviation, so if we square the standard deviation estimates for each task on the critical path, add these together, and take the square root of the result, we get an estimate of the standard error of the project finish date.
The problem is that it totally ignores any paths other than the one that appears critical based upon the presumed expected durations. In reality, there may be paths that are nearly critical on this basis and that, given the uncertainty in the duration estimates, might in actual fact turn out to be critical. It turns out that these other paths interact in a rather complex way, creating a systematic error, or bias, which means that PERT underestimates how long the project will take.
(In his excellent book, The Flaw of Averages, Sam Savage explains the danger of using averages to represent a range of possible outcomes. At the very least this approach fails to reflect the uncertainty inherent in the data; but in many cases it actually introduces bias due to what he calls the “Strong Flaw of Averages.” Project networks are such a case.)
Monte Carlo Simulation
Monte Carlo Simulation is a technique that has application in many areas. In particular, it can be used wherever we have a predictive model with stochastic elements that interact in a way to make analysis intractable. A project network is such a model, because the various tasks combine in complex ways, sometimes in series and sometimes in parallel. The only practical way to make projections based on such models is Monte Carlo simulation.
Monte Carlo simulation gets its name from the famous casino and proceeds by:
- Generating random samples from distributions representing the random variables in a model — in the present case, the durations of the tasks in a project network;
- Calculating the model as if these sampled values were the known actual values — in the present case, to determine values of interest such as the project completion date; and
- Repeating this process a large number of times (known as “trials”) in order to build up a histogram of these values of interest.
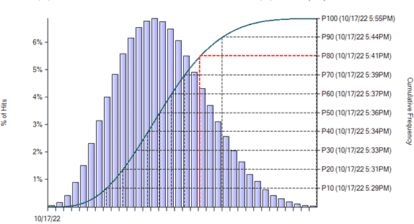
Monte Carlo simulation thus takes into account the uncertainty associated with all task durations, not just those on the supposed critical path. As a result, it’s quite possible that the critical path will be different on different trials, in other words with different random samples from the duration distributions. And this is what causes “merge bias” (to be discussed shortly). But even in the absence of such bias, it’s worthwhile to get a realistic assessment of the likely project completion date. The following graph shows the cumulative probability of completing a project by any particular date.
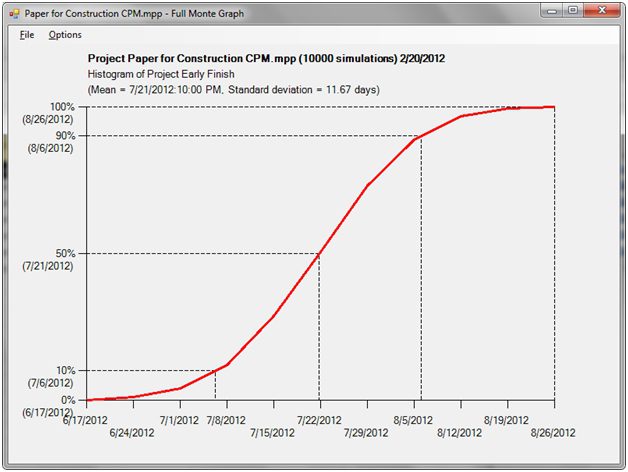
The expected finish date, which is also the median finish date, is 7/21/12. But there’s a 10% chance that the project won’t finish before 8/6/12. If the completion date is critical, for example because of penalty clauses, one would want to make sure that the date enshrined in the contract is not the expected date or the most likely date, but a date that one can be reasonably confident of meeting.
Merge Bias
Merge bias is probably the single most important reason why PERT is incorrect and why Monte Carlo simulation is the only way to properly process uncertainty in project networks. Merge bias occurs whenever two or more paths converge in a network and the uncertainty about their durations is such that any of them might turn out to be critical.
To illustrate, consider a task with just two predecessors that run in parallel. Suppose that each could take anything from one to six days with equal probability. And suppose further that they won’t take fractions of a day. This may sound rather contrived, and it is; I’m doing it so we can simulate it with a pair of dice and not get involved in a lot of calculus.
The expected duration of the individual tasks is 3.5. But what is the expected time for them both to be complete Lets use the dice to find out. The following table shows all 36 possible outcomes when throwing two dice. The numbers inside the grid show what the highest dice face would be in each combination. For example, if one throws a three dice and a five dice, five would be the highest dice face.

We can’t illustrate this so easily for more dimensions, which correspond to more parallel tasks, but we can still calculate the odds. With three parallel tasks the expected value is almost five days; with five tasks, it’s about 5.4 days; and with 10 tasks, it’s about 5.8 days. (For details on how this is calculated, you can download an Excel spreadsheet from Barbacana). Notice that two would be the highest dice thrown only three times in all 36 possible outcomes. Six, on the other hand, surfaces no fewer than 11 times. So even with just two parallel paths we can see that the time it takes for both of the tasks to be complete is likely to be longer than the deterministic estimate of 3.5 days. If we do the math, we find that the expected value is actually almost 4.5 days.
When a Single Point Estimate Isn’t Good Enough…
Merge bias is one good reason to do schedule risk analysis. But as I’ve shown, there are other reasons too. If meeting a particular completion date is important — for example, because you’re building facilities for the Olympics — then a single-point estimate simply isn’t good enough. In fact, the only thing you can be certain of with a deterministic projection is that it will be wrong. A projection represented by a probability distribution based upon Monte Carlo simulation is always more realistic.