Microsoft Excel, an industry standard for data analysis, is studded with functions that can revolutionize the way we interpret data. While some like VLOOKUP and SUM have their deserved fame, there are others that often remain under the radar. Among these unsung heroes, GETPIVOTDATA and Calculated Fields stand out for their sheer versatility and power. This article dives deep into these functionalities, elucidating their potential and importance.
Why GETPIVOTDATA Deserves Your Attention
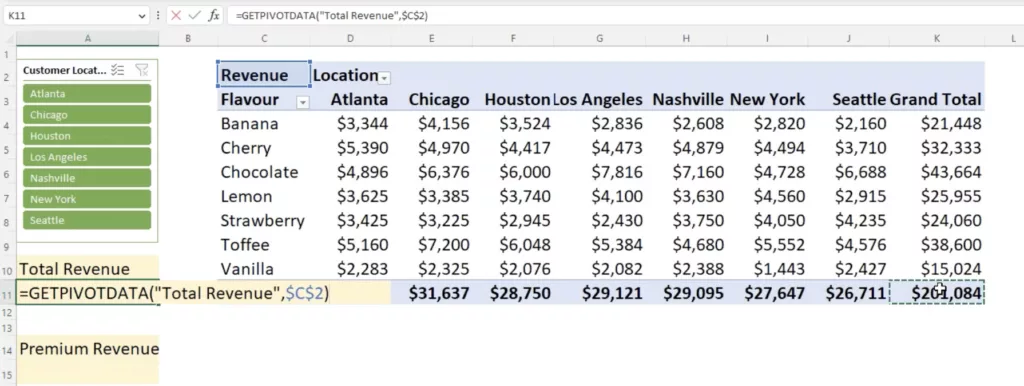
Pivot tables have revolutionized data analysis, making it faster and more intuitive. Yet, a common stumbling block for many is the challenge posed by direct referencing. Change a filter or adjust the layout, and suddenly your direct references can mislead you. This is where GETPIVOTDATA earns its stripes.
Picture this: You want to extract total revenue from a pivot table. A direct approach might point you to a reference like =K11. This seems straightforward until you realize that altering filters can change the value displayed, turning your analysis on its head. GETPIVOTDATA, however, doesn’t just pull a cell’s value. It smartly requests specifics, like the ‘total revenue’, from a pivot table’s starting cell, such as C2, ensuring accuracy even if the table morphs.
The GETPIVOTDATA Advantage:
- Precision: No more guesswork. Extract exactly the metric you need, every time.
- Dependability: The function remains unwavering, delivering accurate results even if the pivot table is tweaked.
- Neatness: Avoid overwhelming your audience. By using GETPIVOTDATA, you can keep your detailed pivot table on one tab and an easy-to-digest summary on another.
The Power of Calculated Fields
In our daily analytical endeavors, sometimes the source data might not present all the metrics we need. It’s here that Calculated Fields come to the rescue.
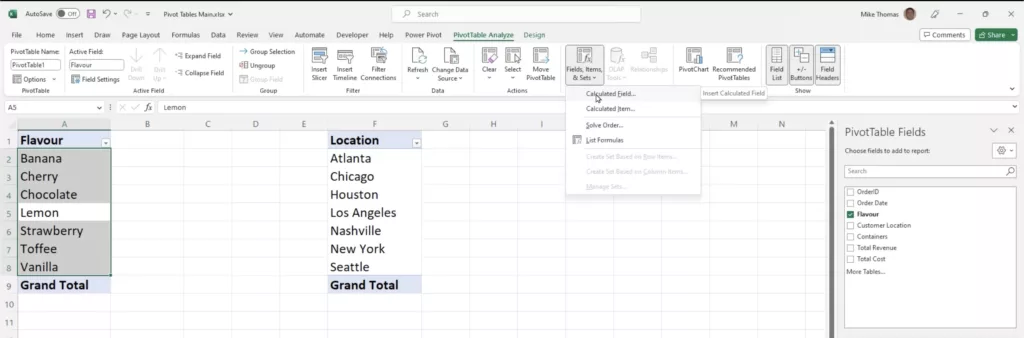
Imagine a company selling ice cream across various locations. Every sale has associated revenues and costs. The natural metric to explore would be the profit. Yet, what if your dataset lacks this column? This is where Calculated Fields prove invaluable. Navigate through Analyze > Fields, Items, & Sets > Calculated Field, label this new field “Profit”, and simply define it as Revenue - Cost. Voila!
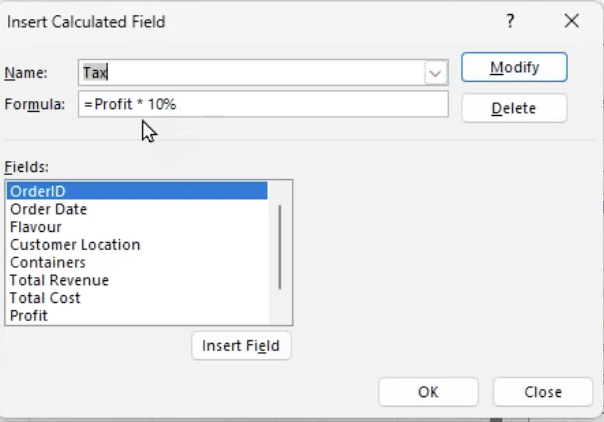
Extending this example, consider a need to account for tax, perhaps 10% of the profit. Again, without meddling with the primary dataset, a fresh Calculated Field named “Tax” can be instituted, defined by Profit * 0.1.
Why Calculated Fields Shine:
- Uphold Data Sanctity: No meddling with original datasets, ensuring the data’s integrity remains sacrosanct.
- Optimize Excel’s Efficiency: Avoid bloating your Excel file with columns laden with formulas. Calculated Fields keep things efficient.
- Uniformity: A calculated field, once established, becomes universally accessible to all pivot tables within the file.
- Dynamic Visualization: Need a new perspective? View profit by location, flavor, or any other parameter by easily dragging and dropping the relevant calculated field.
In Conclusion
While Excel boasts a rich tapestry of functions, tools like GETPIVOTDATA and Calculated Fields offer unique advantages for those willing to explore them. As data analysis becomes more intricate, leveraging these features can lead to sharper insights, streamlined reports, and a refined analytical approach. It’s clear that for the modern data analyst, mastering these tools is not just a luxury, but a necessity.
This article contains highlights from Mike Thomas’s webinar – From Raw Data to Actionable Insights – Mastering Pivot Tables – being provided by MPUG for the convenience of our members. You may wish to use this transcript for the purposes of self-paced learning, searching for specific information, and/or performing a quick review of webinar content. There may be exclusions, such as those steps included in product demonstrations, or there may be additions to expand on concepts. You may watch the on-demand recording of this webinar at your convenience.

Elevate your project management skills and propel your career forward with an MPUG Membership. Gain access to 500+ hours of PMI-accredited training, live events, and a vibrant online community. Watch a free lesson and see how MPUG can teach you to Master Projects for Unlimited Growth. JOIN NOW