Background Information
While you perform resource planning in your projects by adding resources to your project team in the Resource Sheet view, you may need to enter basic and custom cost information for those resources. At a minimum, your organization may require you to enter resource cost rates in the Standard Rate and Overtime Rate fields for each resource. As you enter these resource rates, however, you may discover that these two rates are not enough for your project costing needs. Consider the following examples:
- There will be a change in the resource’s Standard Rate and Overtime Rate in the middle of the project.
- The resource needs to be billed (or costed) at different cost rates depending on the type of task work the resource performs in the project.
To address the two scenarios described above, you will need to use the built-in resource Cost Rate Tables in Microsoft Project. In this blog post article, I will show you how to set up the Cost Rate Tables for a resource and how to apply the correct Cost Rate Table rates after assigning the resource to tasks.
Setting Up Cost Rate Tables
Before you enter information in the Cost Rate Tables for a resource, enter the basic cost rate information for the resource in the Standard Rate, Overtime Rate, and Cost/Use columns in the Resource Sheet view of your project. To enter custom cost information for the resource, double-click the name of the resource. In the Resource Information dialog for the selected resource, click the Costs tab. Figure 1 shows the Costs page of the Resource Information dialog for a resource named Sarah Baker. In the middle of the dialog, notice that Microsoft Project displays the Cost Rate Tables for this resource. Notice that the software includes five Cost Rate Tables, labeled A (Default), B, C, D, and E. Notice that Cost Rate Table A displays the Standard Rate, Overtime Rate, and Cost/Use values which I entered previously for Sarah Baker in the Resource Sheet view of the project.
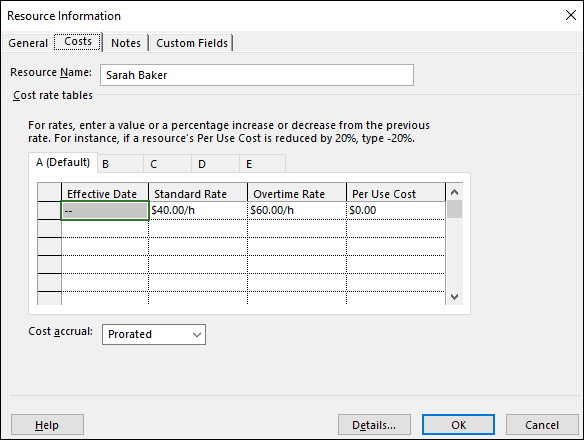
Figure 1: Resource Information dialog, Costs page
In our first scenario, Sarah Baker is currently a Junior Consultant who will be promoted to a Senior Consultant on October 1. On that date, the organization will raise her billing rate from $40/hour to $60/hour. This cost information needs to be reflected in the project schedule so that tasks performed before October 1 are costed at $40/hour, and tasks that occur on or after October 1 are costed at $60/hour. To set up the cost increase, I need to complete the following steps:
1. On the second line of the Cost Rate Table A data grid, click the Effective Date pick list and select October 1.
2. On the second line of the Cost Rate Table A data grid, enter $60/h in the Standard Rate column and $90/h in the Overtime Rate column, such as shown in Figure 2.
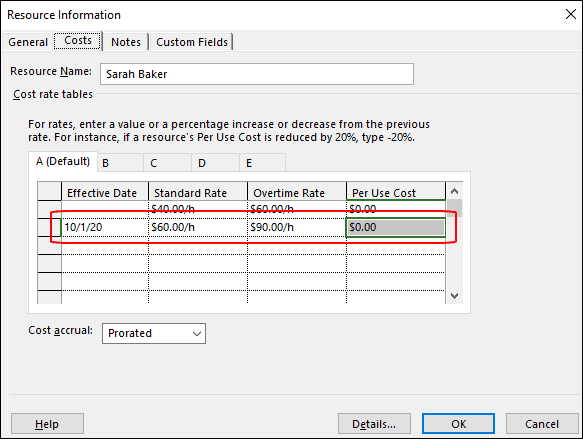
Figure 2: Cost rate increase for Sarah Baker
3. Click the OK button to close the Resource Information
Cost Rate Table A contains the default cost rates used when you assign a resource to a task. You can use Cost Rate Tables B – E to specify alternate cost rates that you can apply when a resource performs work that is costed or billed at a rate different from the default rate.
In our second scenario, Larry Barnes is a Customer Support Specialist who is being groomed to join the QA team to do software testing. His billing rate is $25/hour for customer support tasks and $50/hour for software testing tasks. Figure 3 shows the Costs page of the Resource Information dialog for Larry Barnes. Notice that Cost Rate Table A displays his cost rates for customer support work.
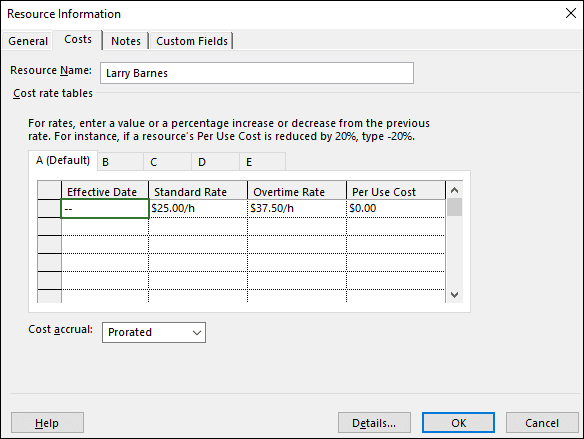
Figure 3: Default cost information for Calvin
To enter an alternate cost rate for testing work, I need to complete the following steps:
1. Click the B tab in the Cost rate tables section of the page.
2. On the first line of the Cost Rate Table B data grid, enter $50/h in the Standard Rate column and $75/h in the Overtime Rate column, such as shown in Figure 4.
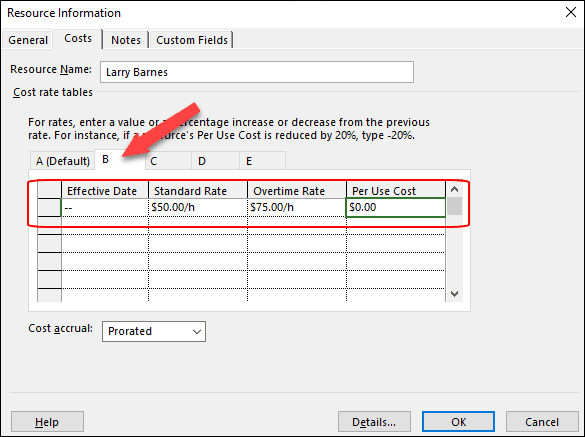
Figure 4: Cost Rate Table B rates for testing work
3. Click the OK button to close the Resource Information
Viewing Cost Rate Changes Over Time
In our first example, I applied a cost rate increase for Sarah Baker, effective on October 1. In the Task Usage view of my project shown in Figure 5, you can see the impact of the cost rate change on one task that starts before October 1 and another task that starts after October 1. Notice that I assigned Sarah Baker to the Build and Rebuild tasks in the project. The Build task occurs during the week of September 20 and the cost rate of $40/h is applied to this assignment, resulting in a Total Cost value of $1,600 (40h x $40/h). The Rebuild task occurs during the week of October 4 and the new cost rate of $60/h is applied to this assignment, resulting in a Total Cost value of $2,400 (40h x $60/h). You can clearly see that Microsoft Project automatically applied the correct cost rate for Sarah Baker, depending on the Start date and Finish date of each of her task assignments.
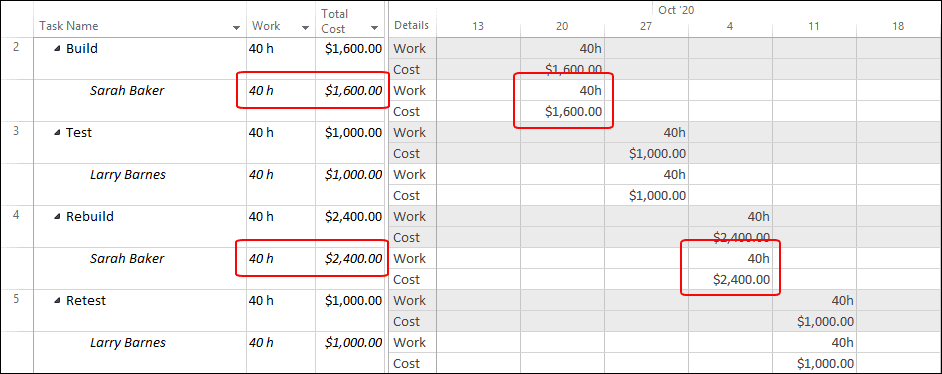
Figure 5: Cost rate changes applied
Applying the Cost Rate Table to a Resource
In my second example, I set up an alternate cost rate for Larry Barnes for software testing work. To apply an alternate cost rate, you must apply the correct Cost Rate Table value for a resource assignment on a task. You can perform this action using either the Task Usage view or the Resource Usage view. In this blog post article, I will demonstrate this action using the Resource Usage view. To change the Cost Rate Table value used for a Larry Barnes’ task assignments, I must complete the following steps:
- Apply the Resource Usage
- Right-click in the Work column header and select the Insert Column item on the shortcut menu.
- In the list of available resource columns, select the Cost Rate Table
- Click the column header of the Add New Column virtual column and select the Cost field in the list of available resource fields.
- Right-click anywhere in the timephased grid on the right side of the view and select the Cost details on the shortcut menu.
Figure 6 shows the Resource Usage view of my project, customized by completing the preceding steps. Notice in the Cost Rate Table column that Microsoft Project initially selected the A value for each of the three tasks assigned to Larry Barnes. Because the rate on Cost Rate Table A is $25/h, notice that the software calculated the cost for each of his task assignments as $1,000 (40h x $25/h).
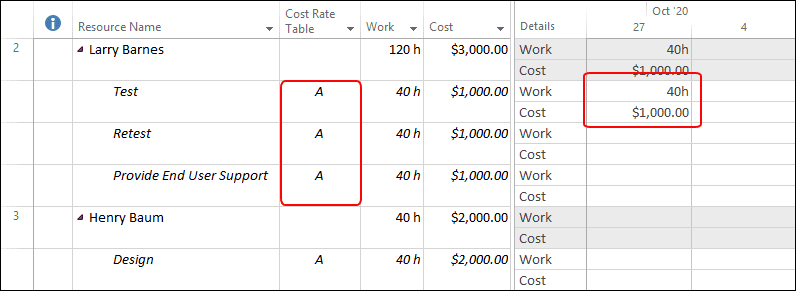
Figure 6: Resource Usage view with the Cost Rate Table column inserted
The Test and Retest tasks must be billed at the higher cost rate specified on Cost Rate Table B. To change the cost rate for these two tasks, I must select the B value in the Cost Rate Table column for each task. When I perform this action, Microsoft Project automatically applies the higher cost rate for software testing task, the results of which are shown in Figure 7. Notice that for the Test and Retest tasks, Microsoft Project calculated the new Cost value of $2,000 for each task (40h x $50/h), which is the correct billing cost for each task.
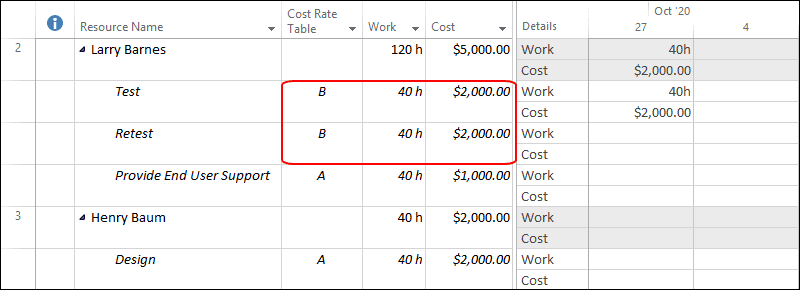
Figure 7: Cost Rate Table B rate applied
Note: When you initially assign a resource to a task, Microsoft Project always applies the cost rate shown on Cost Rate Table A for the resource. There is no way to change this default behavior. If you need to apply an alternate cost rate using Cost Rate Tables B-E, you must perform this action in either the Task Usage view or the Resource Usage view. This is because Microsoft Project applies the selected Cost Rate Table value at the assignment level, and these two views are the only views that display assignments.