Introduction
Keeping your project under control requires a periodic look for tasks that are not progressing as originally planned. As a first step, you must track progress by entering Actual Work, Remaining Work, Actual Start and Actual Finish. Once you have captured this information you’re ready to analyze plan variances—that is: tasks where progress is out of sync with the baseline (original estimates).
Before we look at these variances let’s briefly review some definitions. Project automatically calculates the difference between current progress and original estimates and places the result into five different variance fields as follows:
Work Variance = (Work – Baseline Work)
Cost Variance = (Cost – Baseline Cost)
Start Variance = (Start – Baseline Start)
Finish Variance = (Finish – Baseline Finish)
Duration Variance = (Duration – Baseline Duration)
I find it easier to remember these fields as follows: think of Work as “Current Estimated Work” and Baseline Work as “Original Estimated Work.” The Work Variance is then the difference between your Current Estimated Work and your Original Estimated Work. The same holds true for the other four variance fields listed above.
Note that anytime the “Current Estimated” values are higher than the “Original Estimated” (Baseline) values, the resulting variance will be a positive number. This means that any variance that is greater than zero is exceeding your original estimates and is considered “unfavorable.”
The easiest way to hone in on unfavorable variances is to build a set of tables and filters that are combined into views so that it is easy to quickly locate them. Let’s look at how we can customize these views to catch trouble early.
Isolating Unfavorable Work Estimates for Tasks
The first analysis we’ll perform is for work estimates that are higher than the original Baseline Work. We’ll use a “Single View” — which combines a filter and a table — so that we can view a table that contains all the relevant work-related fields alongside a filter to look for unfavorable Work Variances.
Figure 1 shows the contents of the Work Table. From the View:Data tab on the ribbon, choose Tables, then scroll down to More Tables. From the More Tables dialog box, tick the task at the top, click on the tablenamed “Work,” and then select Edit. As you can see, the Work Table shows not only the Work Variance field, but also, other work fields that will help you see how the Work Variance was calculated.
Figure 1:

Click Cancel for now.
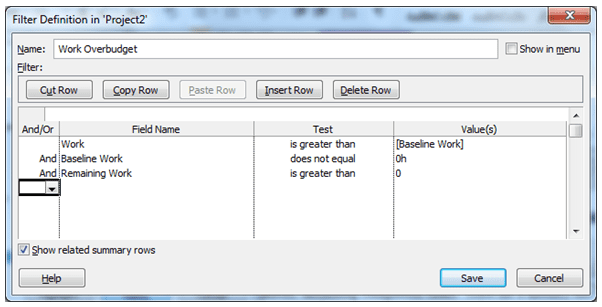
Figure 2 shows the contents of the Work Overbudget filter.
From the View:Data tab on the ribbon, use the drop down list against the Filter icon, then More Filters.
From the More Filters dialog box, click on the filter named “Work Overbudget,” and then the Edit button. As you can see, the Work Overbudget filter looks for tasks that have Actual Work in excess of Baseline Work and Baseline Work not equal to ‘0h’ (meaning there was work scheduled to the task and the task was baselined).
Figure 2

Now, let’s build a View that combines the Work table with the Work Overbudget filter. From the View:Task Views tab on the ribbon, choose Task Usage:More Views. In the More Views dialog box, click on the New button.
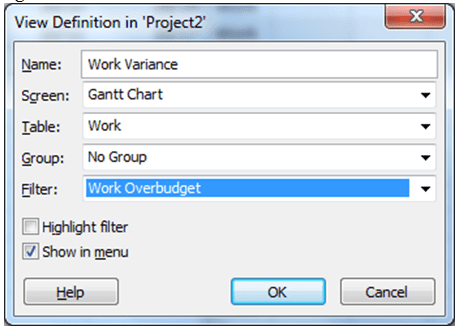
In the Define New View dialog box, click on Single View, then OK. Figure 3 shows the View Definition dialog box with the proper options applied. In the Name field, type “Work Variance.” In the Table drop-down, choose “Work.” In the Group drop-down, choose “No Group.” In the Filter drop-down, choose “Work Overbudget.” To add this new view to your View menu, select the Show in Menu option box. Click OK.
Figure 3:
You are now ready to apply the new Work Variance view to look for tasks for which Actual Work is higher than you originally predicted. From the More Views dialog, select “Work Variance” and click Apply. Figure 4 shows a typical sample of this view.
Figure 4:

Modifying the Work Overbudget Filter to Be Proactive
You may wish to look for unfavorable Work Variances for tasks that are not complete. These are the tasks that you might still be able to finish within their estimated work amount by reducing the scope. In the previous example, we looked at all tasks with unfavorable work variances, comparing Actual Work with Baseline Work. Now let’s modify the Work Overbudget filter to look for tasks that are in trouble, but not yet complete.
From the View:Data tab on the ribbon, use the drop-down list against the Filter icon, then More Filters. From the More Filters dialog box, select the filter named “Work Overbudget,” and click Edit. On the first line, use the drop-down against “Actual Work” and select “Work” from the displayed list of fields. On the third line, type “And” in the And/Or column. Under the Field Name, choose “Remaining Work” from the drop-down. In the Test field, type (or choose from the drop-down) “is greater than.” In the Value(s) field, type “0h.” Figure 5 shows the new Work Variance filter.
Figure 5:
Click Save. Now, when you run your new Work Variance view, you will see unfavorable work variances for tasks that still have not completed, as in Figure 6.
Figure 6:

Isolating Unfavorable Start and Finish Variances
It might be tempting to look only for tasks with work plan estimates that are in excess of your original baseline work estimates—that is, unfavorable Work Variances. It is, however, equally important to analyze how your dates are progressing. If Baseline Work is 1,000 hours, Actual Work is 500 hours, and Remaining Work is 500 hours, then Work is equal to 1,000 hours and Work Variance is zero. Sounds pretty good, right? But what if you are 8 months into a 10 month project? Assuming an even resource load, you should have consumed 800 hours by now, but your Actual Work is only 500 hours.
This example highlights the importance of analyzing Start and Finish Variances in addition to Work Variances. If we were to look at the Start and Finish Variances in this 1,000 hour project, we would most likely find that tasks are not starting or completing on time. Let’s see how to quickly isolate all tasks with unfavorable Start and Finish Variances.
First, we’ll find a table that contains the relevant Start and Finish date/variance field.
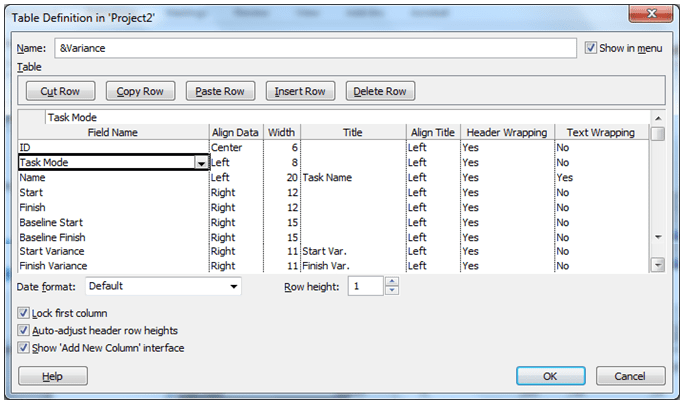
Figure 7 shows the contents of the Variance Table. From the View:Data tab on the ribbon, choose Tables:More Tables. From the More Tables dialog box, click on the table named “Variance,” then click the Edit button. As you can see, the Variance Table shows not only the Start and Finish Variance fields, but also other Start and Finish fields that will help you see how the Start and Finish Variances were calculated.
Figure 7:
Since Project does not come with a filter to show unfavorable Start and Finish Variances, we’ll have to build one.
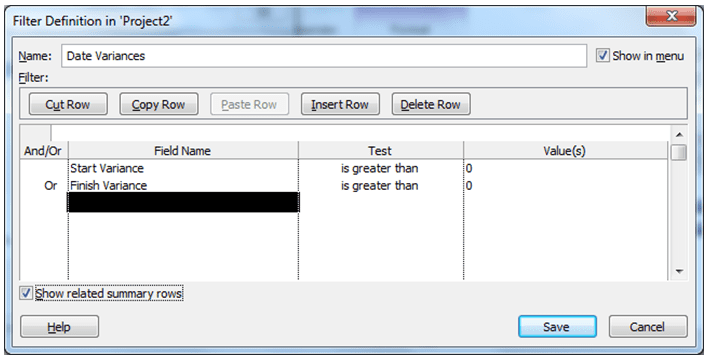
From the View:Data tab on the ribbon, use the drop down list next to the Filter icon, then More Filters. From the More Filters dialog box, click on the New button in the right side-bar. Name the filter “Date Variances.” On the first line under the Field Name column, select “Start Variance” from the drop-down. Under the Test column, select from the drop-down “is greater than.” In the Value column, type “0.”
Now, go to the second line. In the And/Or column, select “Or.” Under Field Name, select “Finish Variance” from the drop-down. Under the Test column, select from the drop-down “is greater than.” In the Value column, type “0d.” Select the check box Show Related Summary Rows.
Figure 8 shows what the new Work Variance filter should look like. Click Save, and Apply the “Work Variance” filter you just created from the More Filters dialog box.
Figure 8:
Now, let’s build a View that combines the Variance table with the Date Variances filter. From the View:Task Views tab on the ribbon, choose Task Usage:More Views. In the More Views dialog box, click the New button.
In the Define New View dialog box, tick Single View. Click OK. Fill out the fields as follows: in the Name field, type “Late Dates”; in the Table drop-down, choose “Variances”; next to Group, choose “No Group”; in the Filter drop-down, choose “Date Variances.” To add this new view to your View menu, select the Show in Menu option box. Figure 9 shows the new Late Dates view.
Figure 9:

Once you click OK, you are ready to Apply the new Late Dates view from the More Views dialog, which will allow for you to see the tasks with Start to Finish date estimates later than originally predicted. Figure 10 shows a sample of this view.
Figure 10:

Closing Thoughts on Variance Analyses
Working with Large Plans
For a large work plan, you may find that looking at variances at the task level provides too much detail. In this case, use the Show Outline Level option to automatically limit the displayed project to a selected number of top levels. From the View:Data ribbon, select the Outline function. From here click on whichever number of levels you want to see displayed.
Resource Work Variances
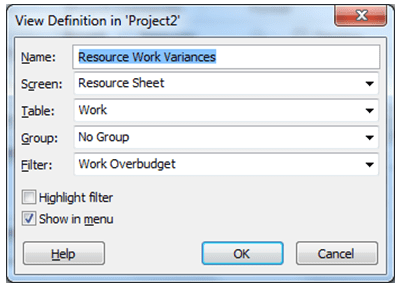
The Work Variance view you created to look at unfavorable task variances can also be built to look at unfavorable Work Variances by resource. In this case, start by applying the Resource Sheet. Follow the same steps you followed in the previous example (see Isolating Unfavorable Work Estimates for Tasks) to build a new Single View, this time naming it Resource Work Variances. Use the Work table and Work Overbudget filter again, but this time, next to Screen, choose the “Resource Sheet.” The resulting options should look as follows:
Figure 11:
Caution when Interpreting Variances
Whenever you view Work Variances, you are looking at a “raw” number. These raw numbers can be deceiving. For example, a 6-hour variance might be viewed as more serious than a 4-hour variance. But what if the 6 hour variance is for a task with Baseline Work of 100 hours and the 4-hour variance is for a task with Baseline Work of 20 hours? The 6-hour variance is 6% of the total Work while the 4-hour variance is 20% of the total Work. You may wish to consider the “Percent Variance” before determining which tasks require the most attention.
______________
Now that you know how to analyze a work plan for unfavorable variances, you are ready to stay in control by revising your plan to recover your schedule and complete on-time and on-budget. Successful project management relies on the project manager’s ability to spot trouble early through good tracking and analysis practices.