
Author: Dale Howard
Dale Howard is currently a Senior PPM Consultant with Arch Systems, Inc. His hair and beard have turned white because of using Microsoft's project management tools for more than 20 years. Dale started his career using Microsoft Project 4.0 for Windows 95 and began using Microsoft's PPM tools when they introduced Project Central in 2000. Dale is the co-author of 23 books in Microsoft Project, Project Server, and Project Online. He is currently one 0f 26 Microsoft Project MVPs in the entire world and one of only 4 Project MVPs in the United states.
Saving and Using Personal Templates in Microsoft Project
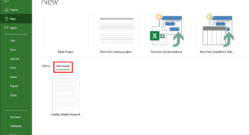
Background Information A few weeks ago, I created a Tips and Tricks video on creating and using personal templates in Microsoft Project. The step that is required for using personal templates is not obvious, so that I thought I would write a blog post article about this process. Saving a Personal Project Template You can create a new project template using one of several methods: Start with a blank project schedule and then completely build the project from scratch. As you might surmise, this method requires a lot of work. A second method is to start with a completed project, clean it up, and then save it as a template. Create a new project from one of the free templates that ship with Microsoft Project (which you see on the New page in the Backstage), modify the project, and then save it as a template. For the purposes of this blog post article, I have opted for the third method. Figure 1 shows a new project which I created from the default Market Research template and which I then heavily modified in preparation for saving it as a template. You can make any type of modifications to a project that you want to save as a template. Some of the modifications I made to my project include: I used Text Styles to format every summary task using the turquoise blue color. I formatted the Gantt bars to display the Critical Path. I modified some existing task dependencies and also added missing task dependencies in the project schedule. I added five Generic resources to the project team in the Resource Sheet view of the project. I created a customized Timeline view in the project. Once you have finished modifying your project, you are ready to save it as a personal project template by completing the following steps: 1. Click the File tab and then click the Save As tab in the Backstage. Microsoft Project displays the Save As page, such shown in Figure 2 2. In the lower left corner of the Save As page in the Backstage, click the Browse Microsoft Project displays the Save As dialog shown in Figure 3. By default, Microsoft Project initially navigates to your Documents folder. 3. In the Save As dialog, navigate to the folder where you intend to save personal project templates. I personally like to use the Custom Office Templates subfolder of the Documents 4. In the Save As dialog, enter a name for the template in the File name 5. Near the bottom of the Save As dialog, click the Save as type pick list and select the Project Template (*.mpt) item on the list, such as shown in Figure 4. 6. In the Save As dialog, click the Save Microsoft Project displays the Save As Template dialog shown in Figure 5. 7. In the Save As Template dialog, select every checkbox and then click the Save 8. Close the newly-saved template in Microsoft Project. Setting the Project Option for the Personal Templates Location Your next step is to tell Microsoft Project where you save your personal project templates. To do this, click the File tab and then click the Options tab in the Backstage. In the Project Options dialog, click the Save tab, such as shown in Figure 6. In the middle of the save page, you will see a section named Save templates with a single field named Default personal templates location. By default, this field is blank in Microsoft Project because the software does not know where you save your personal project templates. Click the Browse button at the right end of the Default personal templates location field. Microsoft Project displays the Modify Location dialog shown in Figure 7. In the Modify Location dialog, navigate to the folder where you save your personal project templates. Select that folder and then click the OK button. The Save templates section of the Project Options dialog shows the folder which you selected, such as shown in Figure 8. Click the OK button to close the Project Options dialog and to apply the selected value in the Save templates section of the dialog. Creating a New Project from a Personal Project Template After setting the Default personal templates location value in the Project Options dialog, you are ready to begin creating new projects from your personal project templates. To do this, click the File tab and then click the New tab in the Backstage. Below the list of the four default templates shown at the top of the page, Microsoft Project displays a section with two links. If you click the Office link, the software displays the list of free project templates that ship with Microsoft Project. If you click the Personal link, the software displays your personal project templates, such as the Projility Market Research template shown in Figure 9. Select the name of the personal template from which you want to create a new project. Microsoft Project displays a large dialog in which you can create the new project, such as the one shown in Figure 10. Enter the Start date of the project in the Start Date field and then click the Create button. The software creates a new project that is a duplicate copy of your personal project template with the Start date set to your selected date, such as shown in Figure 11.

Microsoft Project Quick Tip: Using the Predecessors Column to Select Multiple Predecessors
Many years ago, in Microsoft Project for DOS, the only way to set task dependencies was to manually type task ID numbers into either the Predecessors or Successors column for each task in the project. In the Windows versions of Microsoft Project, however, we have also had the option to link tasks by selecting two or more tasks, and then clicking the Link the Selected Tasks button in the Task ribbon. I suspect that most of us use the second of the two previous methods for setting task dependencies because it is so much faster. However, were you aware that you can still manually type task ID numbers in the Predecessors or Successors column to set task dependencies? And more importantly, are you aware that Microsoft introduced new functionality in Microsoft Project 2016 that will allow you to set task dependencies using a new pick list menu in either the Predecessors or Successors column? This new functionality makes it very easy to use the Predecessors column to quickly select multiple predecessors for a single task. For example, consider the project shown in Figure 1. In this project, I need to designate four milestone tasks (Carpentry Complete, Electrical Complete, Plumbing Complete, and Telecommunications Complete) as predecessors to the Construction Complete milestone task. Prior to Microsoft Project 2016, setting these task dependencies would have required a number of steps, either by typing multiple task ID numbers, or by selecting tasks and clicking the Link the Selected Task button multiple times. Thanks to the new feature introduced in Microsoft Project 2016, there is an easier way. To use this new feature, I must begin the process by clicking the pick list button in the Predecessors cell for the Construction Complete milestone task. Microsoft Project displays a pick list menu that displays the name of every task in the project, along with the ID number for each task. Each task in the pick list menu also includes a checkbox which you can select to designate that task as a predecessor to the selected task, such as shown in Figure 2. By the way, to shorten the menu shown in the figure, I collapsed the Carpentry, Electrical, Plumbing, and Telecommunications summary sections. Notice in Figure 2 that I selected the checkboxes for the four milestone tasks in the Construction phase of the project to designate each of them a predecessor to the Construction Complete milestone task. For your own reference, the Successors column also includes the same menu shown previously in Figure 2, which means you can use either column to set multiple predecessors or multiple successors for a selected task. Also, keep in mind that when you set task dependencies by manually typing task ID numbers or by using the menu in either the Predecessors or Successors column, Microsoft Project will always set a Finish-to-Start dependency in response. If you need one of the other three task dependencies, you must edit the dependency information for that task.
Understanding and Using Cost Rate Tables
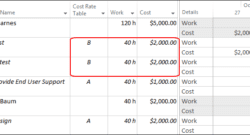
Background Information While you perform resource planning in your projects by adding resources to your project team in the Resource Sheet view, you may need to enter basic and custom cost information for those resources. At a minimum, your organization may require you to enter resource cost rates in the Standard Rate and Overtime Rate fields for each resource. As you enter these resource rates, however, you may discover that these two rates are not enough for your project costing needs. Consider the following examples: There will be a change in the resource’s Standard Rate and Overtime Rate in the middle of the project. The resource needs to be billed (or costed) at different cost rates depending on the type of task work the resource performs in the project. To address the two scenarios described above, you will need to use the built-in resource Cost Rate Tables in Microsoft Project. In this blog post article, I will show you how to set up the Cost Rate Tables for a resource and how to apply the correct Cost Rate Table rates after assigning the resource to tasks. Setting Up Cost Rate Tables Before you enter information in the Cost Rate Tables for a resource, enter the basic cost rate information for the resource in the Standard Rate, Overtime Rate, and Cost/Use columns in the Resource Sheet view of your project. To enter custom cost information for the resource, double-click the name of the resource. In the Resource Information dialog for the selected resource, click the Costs tab. Figure 1 shows the Costs page of the Resource Information dialog for a resource named Sarah Baker. In the middle of the dialog, notice that Microsoft Project displays the Cost Rate Tables for this resource. Notice that the software includes five Cost Rate Tables, labeled A (Default), B, C, D, and E. Notice that Cost Rate Table A displays the Standard Rate, Overtime Rate, and Cost/Use values which I entered previously for Sarah Baker in the Resource Sheet view of the project. In our first scenario, Sarah Baker is currently a Junior Consultant who will be promoted to a Senior Consultant on October 1. On that date, the organization will raise her billing rate from $40/hour to $60/hour. This cost information needs to be reflected in the project schedule so that tasks performed before October 1 are costed at $40/hour, and tasks that occur on or after October 1 are costed at $60/hour. To set up the cost increase, I need to complete the following steps: 1. On the second line of the Cost Rate Table A data grid, click the Effective Date pick list and select October 1. 2. On the second line of the Cost Rate Table A data grid, enter $60/h in the Standard Rate column and $90/h in the Overtime Rate column, such as shown in Figure 2. 3. Click the OK button to close the Resource Information Cost Rate Table A contains the default cost rates used when you assign a resource to a task. You can use Cost Rate Tables B – E to specify alternate cost rates that you can apply when a resource performs work that is costed or billed at a rate different from the default rate. In our second scenario, Larry Barnes is a Customer Support Specialist who is being groomed to join the QA team to do software testing. His billing rate is $25/hour for customer support tasks and $50/hour for software testing tasks. Figure 3 shows the Costs page of the Resource Information dialog for Larry Barnes. Notice that Cost Rate Table A displays his cost rates for customer support work. To enter an alternate cost rate for testing work, I need to complete the following steps: 1. Click the B tab in the Cost rate tables section of the page. 2. On the first line of the Cost Rate Table B data grid, enter $50/h in the Standard Rate column and $75/h in the Overtime Rate column, such as shown in Figure 4. 3. Click the OK button to close the Resource Information Viewing Cost Rate Changes Over Time In our first example, I applied a cost rate increase for Sarah Baker, effective on October 1. In the Task Usage view of my project shown in Figure 5, you can see the impact of the cost rate change on one task that starts before October 1 and another task that starts after October 1. Notice that I assigned Sarah Baker to the Build and Rebuild tasks in the project. The Build task occurs during the week of September 20 and the cost rate of $40/h is applied to this assignment, resulting in a Total Cost value of $1,600 (40h x $40/h). The Rebuild task occurs during the week of October 4 and the new cost rate of $60/h is applied to this assignment, resulting in a Total Cost value of $2,400 (40h x $60/h). You can clearly see that Microsoft Project automatically applied the correct cost rate for Sarah Baker, depending on the Start date and Finish date of each of her task assignments. Applying the Cost Rate Table to a Resource In my second example, I set up an alternate cost rate for Larry Barnes for software testing work. To apply an alternate cost rate, you must apply the correct Cost Rate Table value for a resource assignment on a task. You can perform this action using either the Task Usage view or the Resource Usage view. In this blog post article, I will demonstrate this action using the Resource Usage view. To change the Cost Rate Table value used for a Larry Barnes’ task assignments, I must complete the following steps: Apply the Resource Usage Right-click in the Work column header and select the Insert Column item on the shortcut menu. In the list of available resource columns, select the Cost Rate Table Click the column header of the Add New Column virtual column and select the Cost field in the list of available resource fields. Right-click anywhere in the timephased grid on the right side of the view and select the Cost details on the shortcut menu. Figure 6 shows the Resource Usage view of my project, customized by completing the preceding steps. Notice in the Cost Rate Table column that Microsoft Project initially selected the A value for each of the three tasks assigned to Larry Barnes. Because the rate on Cost Rate Table A is $25/h, notice that the software calculated the cost for each of his task assignments as $1,000 (40h x $25/h). The Test and Retest tasks must be billed at the higher cost rate specified on Cost Rate Table B. To change the cost rate for these two tasks, I must select the B value in the Cost Rate Table column for each task. When I perform this action, Microsoft Project automatically applies the higher cost rate for software testing task, the results of which are shown in Figure 7. Notice that for the Test and Retest tasks, Microsoft Project calculated the new Cost value of $2,000 for each task (40h x $50/h), which is the correct billing cost for each task. Note: When you initially assign a resource to a task, Microsoft Project always applies the cost rate shown on Cost Rate Table A for the resource. There is no way to change this default behavior. If you need to apply an alternate cost rate using Cost Rate Tables B-E, you must perform this action in either the Task Usage view or the Resource Usage view. This is because Microsoft Project applies the selected Cost Rate Table value at the assignment level, and these two views are the only views that display assignments.
Gantt Chart Wizard: A Blast Out of the Past
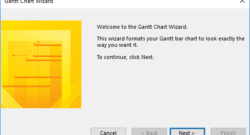
Background I was recently reading the latest posts in the Project Standard and Professional user forum, when I found a recent reply to a question that was originally posted in March 2011. I was greatly amused that anyone would reply to a post that was so old and that was marked as answered so long ago. Out of curiosity, I read this most recent reply, and was hit by a “blast out of the past” as I read it. The original question was how to hide the resource names that are displayed at the right end of the Gantt bars shown in the default Gantt Chart view. This question and several follow up questions were all answered successfully back in 2011. The user who posted the most recently reply, however, offered another way to hide those resource names: use the Gantt Chart Wizard. Truth be known, I have not thought about the Gantt Chart Wizard for at least a decade, if not longer than that. In fact, as an aside, the Gantt Chart Wizard was documented in the first book in which I was a co-author (technically a contributing author), which was the Special Edition: Using Microsoft Project 2002 book, published by Que Publishing. The user’s recent reply made me wonder whether the Gantt Chart Wizard is still available in Microsoft Project 2019. Sure enough, I looked for myself, and this tool is still available. By the way, the Gantt Chart Wizard is a useful little tool for formatting the Gantt Chart pane in any Gantt-based view. For example, did you know the Tracking Gantt view is simply a specially formatted version of the default Gantt Chart view? Using the Gantt Chart Wizard can be a time saver if you want to create your own custom Gantt-based view with a customized Gantt Chart pane. Accessing the Gantt Chart Wizard To access the Gantt Chart Wizard, you will need to add this command to your Quick Access Toolbar by completing the following steps in Microsoft Project: Click the File tab and then click the Options tab in the Backstage. In the Project Options dialog, click the Quick Access Toolbar Microsoft Project displays the Customize the Quick Access Toolbar page of the dialog, such as shown in Figure 1. 3. On the Customize the Quick Access Toolbar page, do the following, as indicated in Figure 1 shown previously: In the upper-left corner of the dialog, click the Choose commands from pick list and select the All Commands In the list of available commands on the left side of the dialog, select the Gantt Chart Wizard In the list of commands on the right side of the dialog, select the command after which you want the new command to be added to your Quick Access Toolbar. Notice in Figure 1 that I want to add the command at the bottom of all commands on my Quick Access Toolbar, after the <Separator> Click the Add >> button in the middle of the dialog. 4. Click the OK button to close the Project Options dialog. Using the Gantt Chart Wizard To use the Gantt Chart Wizard tool, open a project in which you want to customize the Gantt Chart pane, preferably of a custom view you are creating, and then click the Gantt Chart Wizard button on your Quick Access Toolbar. Microsoft Project displays the Welcome page of the Gantt Chart Wizard dialog shown in Figure 2. In the Gantt Chart Wizard dialog, click the Next > button. The Gantt Chart Wizard dialog displays a page that allows you to customize the information you want to display in the Gantt Chart view, such as shown in Figure 3. Select the Standard option to display the default formatting of the Gantt Chart. Select the Critical Path option to display Critical tasks using red Gantt bars and non-Critical tasks using blue Gantt bars. Select the Baseline option to format the Gantt Chart using the formatting in default Tracking Gantt view. Select the Other option and then you can choose one of 13 sets of standard formatting options for the Gantt Chart. You can also select the Custom Gantt Chart option and the wizard will walk you through a series of dialogs in which you select the exact set details you want to display in the Gantt Chart. Select your option on the page and then click the Next > button. If you selected any option other than the Custom Gantt Chart option, the Gantt Chart Wizard displays a page which allows you to select the information that appears with each Gantt bar, such as shown in Figure 4. Select the Resources and dates option to display resource names to the right of the Gantt bars for detailed tasks, and Finish dates to the right of milestones. Select the Resources option to display resource names only for detailed tasks and no information for milestones. Select the Dates option to display Finish dates for both detailed tasks and milestones. Select the None option to omit resource names from detailed tasks and Finish dates from milestones. If you select the Custom task information option, the Gantt Chart Wizard will display a page that allows you to select which fields you want to display to the left, to the right, and inside of every Gantt bar for both detailed tasks and milestones. Select your option on the page and then click the Next > button. If you selected any option other than the Custom task information option, the Gantt Chart Wizard displays a page in which you can choose whether to display link lines between Gantt bars, such as shown in Figure 5. On this page, the default option is Yes, which automatically displays link lines between dependent tasks. You can select the No option, which will not display any link lines between dependent tasks in the project. Select your option on the page and then click the Next > button. The Gantt Chart Wizard displays the Congratulations page shown in Figure 6. On the Congratulations page, click the Format It button to format the Gantt Chart according to your specifications. After the Gantt Chart Wizard finishes its formatting operation, it displays the Finished page shown in Figure 7. On the Finished page of the dialog, click the Exit Wizard button to close the dialog. Before I wrap up this blog post article, let’s go back for a moment to the page in the Gantt Chart Wizard dialog that allows you to customize the information you want to display in the Gantt Chart view, shown previously in Figure 3. What happens if you select the Custom Gantt Chart option? The Gantt Chart Wizard displays a series of pages that allow you to specify every option for formatting the Gantt Chart pane. Specifically, these pages allow you to specify the following: Do you want to display the Critical Path in the Gantt Chart? If yes, what color and formatting do you want to use for the Gantt bars for Critical tasks? What color and formatting do you want to use for the Gantt bars for non-Critical tasks? What color and formatting do you want to use for the Gantt bars for summary tasks? What color and formatting do you want to use for the Gantt bars for milestone tasks? Do you want to display a second set of Gantt bars, such as to show the Baseline schedule, to show the Total Slack for each task, or to show both the Baseline schedule and the Total Slack? What information to you want to display to the right of each Gantt bar for detailed tasks, summary tasks, and milestones, such as resource names and Finish dates? Do you want to display link lines between dependent tasks? From the list of pages that the Gantt Chart Wizard displays, you can see that the wizard gives you total control over how you want your Gantt Chart pane to be formatted. When finished with applying these custom settings, the Gantt Chart Wizard displays the Congratulations page shown previously in Figure 6. And when you click the Format It button on the Congratulations page, it displays the Finished page shown previously in Figure 7. Warning: Keep in mind that if you use the Gantt Chart Wizard to format your Gantt Chart, Microsoft Project will format your Gantt bars according to the styles, colors, and symbols used Microsoft Project 2010 and early versions of the software, and not the way the Gantt Chart view appears in current versions of the software. For example, if you select the Standard display of the Gantt Chart, the software will format the Gantt bars with a darker blue color rather than the light blue color used in Microsoft Project 2013, 2016, and 2019. You can see these old darker blue Gantt bar colors in the dialog shown in Figure 3. Because of this, you may not want to use the Gantt Chart Wizard to format your Gantt Charts. If you are a long-time user of Microsoft Project like I am, I hope you have enjoyed this “blast out of the past” blog post article about our old friend, the Gantt Chart Wizard!

Keyboard Shortcuts in Project for the web
For the past couple of weeks, I have been busy creating training content for the new Project for the Web application. Beyond the usual keyboard shortcuts like Control + C to copy an item to the Clipboard, I have uncovered a number of additional keyboard shortcuts in the software. Most of these keyboard shortcuts apply to the Board view, although a few work in the Timeline view as well. These keyboard shortcuts include: Press the Control + Z keyboard combination to undo previous actions. I am not sure of the limit of the number of Undo actions, but I am able to perform at least 25 Undo actions successfully. Press the Control + Y keyboard combination to redo a previous action. Again, I am not sure of the limit of the number of Redo actions. Select a task and then press the Insert key on your computer keyboard to insert a new blank row above the selected task. Click the task ID number for a task to select the entire task row, then press the Delete key on the computer keyboard to delete the task. You can also select the ID numbers for multiple tasks and press the Delete key to delete all of the selected tasks. Right-click on any task or a selected block of tasks and Project for the Web displays the More options flyout menu for the selected task(s). Select any task or a selected block of tasks and Project for the Web and then press the Alt + M keyboard combination to display the More options flyout menu for the selected task(s). Select any task and then press the Alt + I keyboard combination to display the task pane on the right side of the screen for the selected task. Well, that’s a list of the keyboard shortcuts I have found so far. I suspect that we will see more keyboard shortcuts appearing over time as Microsoft continues to add functionality to Project for the Web.
Creating and Using Project Templates in Project for the Web
Figure 5: More Options menu

Cancel an Unneeded Task
Background Information During the Planning stage of a project, it is appropriate to delete unneeded tasks from the project. After you have saved a baseline for your project, however, it is a very bad practice to delete unneeded tasks. This is because deleting a baselined task also deletes the baseline information about the task, which ends up causing negative project variance that you cannot easily explain. After baselining your project, if you need to delete an unneeded task, the best way to handle this situation is to cancel the unneeded task rather than deleting it. In Microsoft Project, the software offers two methods for cancelling an unneeded task. If you are using the Professional version of Microsoft Project, you can cancel the unneeded task using the Inactivate Task feature. If you are using the Standard version of Microsoft Project, however, there are a series of steps I recommend you follow to cancel the unneeded task. In this blog post article, I discuss these two methods individually. Cancel an Unneeded Task Using Microsoft Project Professional One of the benefits of using the Professional version of Microsoft Project is that the software includes the Inactivate Task feature. Using this feature, you can easily cancel an unneeded task with one click of the mouse button. For example, consider the project shown in Figure 1. In this project, executive leadership has opted to cancel the Provide End User Support task to save money and to finish the project early. To cancel a task using the Professional version of Microsoft Project, select the task you want to cancel, and then click the Task tab to display the Task ribbon. In the Schedule section of the Task ribbon, click the Inactivate toggle button. Figure 2 shows the Inactivate button, along with the tooltip displayed when you float your mouse pointer over the button. When you cancel a task using the Inactivate toggle button, Microsoft Project does the following: The software formats the text of the cancelled task using the Strikethrough font effect and the gray font color. The software formats the Gantt bar of the cancelled task using a hollow (unfilled) pattern. The software treats the cancelled task as if it has 0h of Remaining Work. This means the cancelled task no longer affects resource availability for the resources assigned to it, as indicated in the tool tip shown previously in Figure 2. The software cancels the dependency relationship between the cancelled task and its immediate successor task, and schedules the successor task as if it is linked to the immediate predecessor of the cancelled task. The software enters a No value in the Active field for the task. Microsoft Project uses the Active field for filtering and grouping tasks. Figure 3 shows the Provide End User Support task after cancelling it using the Inactivate toggle button. Notice how the formatting of both the task and its Gantt bar make it very easy to see that this task has been cancelled. Note: In the Resource Usage view, Microsoft Project applies the Strikethrough font effect to the cancelled task assignment as well as to the Work hours displayed in the timephased grid on the right side of the view. Cancel an Unneeded Task Using Microsoft Project Standard To demonstrate how to cancel an unneeded task using the Standard version of Microsoft Project, I will use the same project shown previously in Figure 1, in which I need to cancel the Provide End User Support task. Since the Standard version of Microsoft Project does not include the Inactivate toggle button, I recommend you use the following manual process to cancel an unneeded task: 1. Apply the Gantt Chart 2. Right-click on the Select All button (blank button in the upper-left corner of the task sheet) and select the Work table on the shortcut menu. 3. In the Work table, set the Remaining Work value to 0h for the task you want to cancel, such as shown in Figure 4. When you complete this step, Microsoft Project recalculates the Duration of the task to 0d, and then changes the Gantt bar to the milestone symbol (a black diamond). 4. In the Gantt Chart pane, double-click the milestone symbol (black diamond) for the cancelled task to display the Format Bar 5. In the Start section of the Format Bar dialog, click the Shape pick list and select an alternate symbol that you want to use to represent a cancelled task, such as the solid circle shape shown in Figure 5. 6. In the Start section of the Format Bar dialog, click the Color pick list and select a color other than black. Click the OK button when finished. 7. Click the row header for the cancelled task to select the entire task row. 8. In the lower-right corner of the Font section of the Task ribbon, click the Font Dialog Launcher button (it looks like a little arrow). 9. In the Font dialog, select the Strikethrough checkbox, such as shown in Figure 6. Click the OK button to apply the Strikethrough font formatting. 10. Double-click the task and then click the Notes tab in the Task Information 11. On the Notes page of the Task Information dialog, add a note to document the reason for cancelling the task, and then click the OK Figure 7 shows the Provide End User Support task after cancelling the task using the preceding method in the Standard version of Microsoft Project.

Delay the Start of Resource Work on a Task
A Problem and a Solution Several months ago, there was an interesting question in the Project Standard and Professional user forum on the Internet. The user who posted the question had the following situation in his Microsoft Project schedule: He needs to assign two resources to a task. Each resource will work full-time for 80 hours. The second resource will not start work on the task until the first resource is finished. The third bullet point describes the challenge. How do you delay the start of the second resource so that the resource does not start work on the task until after the first resource is finished? My answer to this user’s question will reveal a feature of the Task Form view of which you may not be aware. The solution to this user’s situation is as follows: 1. Apply the Gantt Chart view and then select the task in question. 2. Right-click anywhere in the white or gray part of the Gantt Chart pane and then select the Show Split item on the shortcut menu. Microsoft Project displays the Task Entry combination view, with the Gantt Chart view in the top pane and the Task Form view in the bottom pane, such as shown in Figure 1. 3. In the Task Form pane, select the names of the two resources, enter a Units value of 100% for each resource, and enter 80h in the Work column for each resource. Click the OK button to assign the resources. Microsoft Project will calculate a Duration value of 10d for the task, such as shown in Figure 2. 4. Right-click anywhere in the Task Form pane to display the shortcut menu shown in Figure 3 and then select the Schedule item on the shortcut menu. Microsoft Project displays the Schedule set of details in the Task Form 5. In the Task Form pane, enter 10d in the Delay column for the second resource, such as shown in Figure 4, and then click the OK Microsoft Project recalculates the Duration of the task as 20d because the assigned resources are working consecutively, each for 10 days. 6. Right-click anywhere in the Task Form pane and select the Resources & Predecessors item on the shortcut menu. To confirm that Microsoft Project correctly scheduled the resources on this task, Figure 5 shows the Task Usage view, zoomed to the Weeks level of detail. Notice that Gary Hayward is working 40 hours each week during the first two weeks of the task, while Quinlyn Baker is working 40 hours each week during the last two weeks of the task. Additional thoughts on the Task Form view? Leave a comment below.