
In this article, we are going to explore Earned Value Management (EVM), a widely used traditional management technique, but we are going to look at it within the context of an Agile domain.
Let’s consider an example scenario. A product manager, who works for a large aircraft manufacturing organization in the United States, follows a hybrid model of development and, with his team, releases a new version of aircraft handling software every couple of weeks. At the start of each iteration, he may be unsure about the applicability of earned value analysis, measurement, and management within Agile. His main questions may be:
- How can we apply EVM while following an Agile approach? Is it natural?
- With frequent scope changes, how does one determine what to measure against?
- Scope change is also frequent on the iteration level! How can we incorporate EVM metrics in such cases?
To understand EVM, one needs to understand the concept of baseline, first and foremost. In EVM terminology, baseline is further defined as the performance measurement baseline (PMB). Let’s first define PMB, because, as I’ve seen, the lack of clarity regarding EVM is typically due to lack of PMB understanding.
Performance Measurement Baseline (PMB)
The PMB is a virtual (not physical) baseline integrating scope, schedule, and cost baselines. In other words, PMB is the time-phased budget of authorized work for a project or program.
EVM is fundamentally based on this baseline–irrespective of chosen life cycle, be it predictive (Traditional), adaptive (Agile), or any other. It doesn’t matter how many iterations (or sprints, if in Scrum) you have or how frequently the scope changes. For EVM, it matters where and how you are setting your baseline. We will see shortly where the baseline is an Agile context. As EVM integrates scope, schedule, and cost, it’s quite a powerful technique. This is shown in the below figure.

Another issue occurs when management practitioners incorrectly interpret earned value as being business value. Earned value is not business value, rather it’s the value that you have earned in terms of money after completing the work. Hence, it’s actually a measure of work performance or performance against the set baseline or PMB.
With these fundamentals in mind, let’s now consider the foundational metrics in EVM.
Foundational Metrics in EVM
The foundational metrics in traditional EVM are noted in the below table. I call them the foundational (or basic) metrics, because, based on these metrics, current and future performance metrics are derived.
As you go through the metrics in EVM, one key thing is to remember is this: everything is in terms of money. The budget, of course, will be in terms of money, and the work planned and work performed or executed, will also be in terms of money in this case.

We will look at the usage of these foundational metrics for Agile development shortly. Note that with these foundational metrics in place, we derive performance metrics of EVM.
Current Performance Metrics in EVM
The current performance metrics used to calculate EVM are noted in the below table for a Traditional environment. I call these metrics current performance metrics, because the measurement happens on the status date, data date, or record date. The good news is, that these foundational metrics remain the same for Agile projects and/or programs. Keep reading, as we are going to reuse these performance metrics in the next section.

It’s pertinent to note the behavior of SV and CV. If they are positive or negative, then the project or program is ahead of or behind schedule and cost, respectively. Similarly, if SPI and CPI are above or below 1.0, then the project or program is ahead of or behind schedule and cost, respectively.
Using EVM in Agile Approaches
When using EVM in an Agile approach or environment, we circle back to the concept of baseline. In Agile projects, the baseline at the release level, not at an iteration level must be considered.
You may be wondering why. In Agile approaches, work is considered “done” at the end of each iteration (or sprint). While it’s true that story points are used to relatively estimate work items being taken-up, work is not considered to be fully “done” until the end of the iteration. If an item is not done, then it’s usually pushed into the next iteration. Hence, measurement during an iteration adds no value. This is because the work can’t be complete/done (or incomplete/not-done) mid- iteration.
If a story is complete, only then is it considered “done.” If a story is partially complete, (say only transition testing is remaining, then it’s not considered to be “done” at all). As you can see, it’s futile to have a baseline at an iteration level.
Are you wondering now how to calculate the performance measurement baseline (PMB) at a release level?
Simply add up the number of story points that you have planned for the release. While the PMB is at the level of the release, we do the measurement at the end of every iteration. In other words, our status date or data date is set for the end of the iteration. This is because, at the end of the iteration, we know the amount of work completed or “done.” And, this work counts towards velocity. Velocity, as explained in this article, also can inform the number of iterations in a release. You can decide to have measurement at the end of any iteration – iteration 1, iteration 2, and/or iteration-N.
A (product) backlog-based representation with earned value related calculations is depicted in the figure below.

As shown, the EV, PV, and AC values are calculated on the status/data date, which occurs at the completion of the iteration. The PMB is set for the release, and this also informs the budget at completion (BAC) for the release.
Next, we will consider the metrics associated with EVM in an Agile environment.
EVM Metrics in Agile Approaches
The foundational EVM metrics used in Agile are noted in the below table with explanations. As you can see, the traditional metrics of EV, PV, AC, and BAC are also taken-up in Agile development; however, the explanation and understanding with respect to Agile contexts are different.

The values for PV, EV, and AC are calculated at the end of every iteration (you can set the status date as of the end of the concerned or considered iteration), whereas the BAC is determined at the release level. This is in sync with the backlog-based representation that we saw earlier.
The budget at completion (BAC) at the release level will be calculated as follows:
Budget at Completion (BAC)
= Total budget for the release
= Number of Items in the Release * Cost per backlog items (or cost per PBI)
For every item in the backlog (PBIs), cost is usually considered, which is one of the key product prioritization factors.
Now that we have the BAC, we can easily calculate the EV and PV, respectively with the below formulas:
First taking PV, the formula will be:
Planned Value (PV)
= Percentage of planned complete * BAC
= % of planned complete * BAC.
Earlier I said, PV, EV, and AC, etc. are calculated as of the status/data date or the iteration completion date. Considering an scenario where you have five iterations in a release and you are measuring at the end of the 2nd iteration, we’d see the following: case:
Percentage (%) of planned complete
= Iteration number / Number of iterations
= 2/5
= 40%
The formula for earned value (EV) will come out as shown below.
Earned Value (EV)
= Percentage of actual complete * BAC
= % of actual complete * BAC.
Why are we considering percentage of percentage of actual complete for EV? It’s because earned value is the value that you have earned by completing the work or having “done” the work.
To determine the percentage of actual completed work, you have to consider the stories that have been completed at the end of an iteration. Let’s say you have completed 40 story points worth of work out of 200 in a release, and you’re at the end of 2nd iteration. The percentage is calculated as follows:
Percentage (%) of actual complete
= Story points completed (or done) / Total story points
= 40/200
= 20%
I’ve summarized the calculations in the below table.

So far, we have shown small examples with respect to BAC, PV, EV, and AC. Based on these metrics, we can easily calculate the current performance metrics of SV, CV, SPI, and CPI using the formulas mentioned in Table – 2.
For this purpose, let’s take an example from the book, I Want to Be An ACP, to compute the associated metrics.
An Example – EVM In Agile
A project is being released in an Agile mode. Below are the details for the project:
- Product Backlog = 500 story points
- In the first release = 200 story points
- Velocity = 25 points per iteration
- Cost per point = $1600
- At the end of 1st iteration, actual cost incurred was $30,000.
- At the end of 1st iteration, story points completed were 20 story points.
With this, we can determine the following.
- Budget at Completion (BAC)
- Number of Iterations
- Planned value per iteration (PV) and Earned Value (EV) for the first iteration
- Schedule Variance (SV) and Cost Variance (CV)
- Schedule Performance Index (SPI) and Cost Performance Index (CPI)
If you have understood so far, you can try it on your own and determine the values being asked in the above questions.
To confirm your understanding and reaffirm your answer, the solution is noted below.
Budget at Completion (BAC)
= Cost per point * Number of story points
= $1600 * 200
= $320,000
Total number of Iterations
= Story points in a release / Velocity
= 200 / 25
= 8
Percentage (%) of planned complete at the end of first iteration
= Iteration number / Total number of iterations
= 1 / 8
= 12.5%
Percentage (%) of actual complete at the end of first iteration
= Total number of story points completed / Total number story points planned
= 20 / 200
= 10%
Now that we have the needed values, let’s calculate the other associated metrics of PV, EV, and AC.
Planned Value (PV) for the iteration
= % of planned complete * BAC
= 12.5% * $320,000
= $40,000
Earned Value (EV) for the iteration
= % of actual complete * BAC
= 10% * $320,000
= $32,000
The actual cost (AC), as mentioned in the question
= $30,000.
With these calculations, we can now determine the current performance metrics of the project at the end of the first iteration.
Schedule Variance (SV)
= EV – PV
= $32,000 – $40,000
= – $8,000
Cost Variance (CV)
= EV – AC
= $32,000 – $30,000
= + $2,000
Look at Table – 2. One could say the release is behind schedule and under budget by looking at the performance metrics of SV and CV, respectively. This is because SV is negative (bad), whereas CV is positive (good).
Next, let’s determine the values for SPI and CPI.
Schedule Performance Index (SPI)
= EV / PV
= $32,000 / $40,000
= 0.8
Cost Performance Index (CPI)
= EV / AC
= $32,000 / $30,000
= 1.07
Again, referring to Table – 2, you could say the release is behind schedule and under budget by looking at the performance metrics of SPI and CPI, respectively. This is because SPI is below one (bad), whereas CPI is above one (good).
Representation in S-Curve
Like a traditional EVM, in Agile context, you can also depict the various EVM metrics in an S-curve. These curves are frequently used in many projects to depict the progress and status reporting. However, your perspective has to change/adapt for the Agile context.
An S-curve showing BAC, EV, PV, AC, SV, and CV is shown in the below figure.
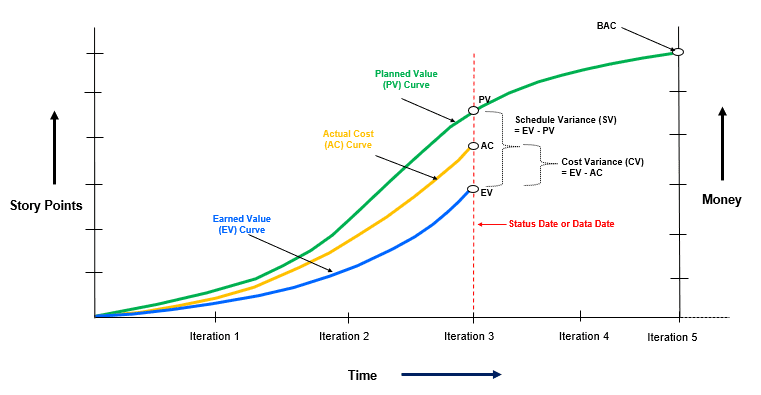
The BAC is at the release level. The PMB line is along the EV curve. Our status date or data date is at the completion of Iteration – 3, and, on this date, we are measuring the foundational metrics of PV, EV and AC, as well as the current performance metrics of SV, SV, and hence, associated SPI and CPI. When you combine this representation with estimated story points in the product backlog, you can have the release burn-up chart.
Video – Earned Value Management in Agile
As we close, I want to summarize the foundations of EVM in Agile in the below video, taken from the book, I Want To Be An ACP [Duration: 13m:05s]. This video notes certain key points you should keep in mind when calculating earned value in an Agile domain. It also further explains the above S-curve. For the best experience, you may want to go full-screen in HD mode and plug-in your earphones.
With this, I believe, I leave you with the fundamentals of earned value management executed in Agile environments.
If you have comments, suggestions, or new ideas, please do share them below.
References
[1] Book: I Want To Be A PMI-ACP: The Plain and Simple Way, 2nd Edition, by Satya Narayan Dash
[2] Project Management Body of Knowledge (PMBOK) Guide, 6th Edition, by Project Management Institute (PMI)
[3] Book: I Want To Be A PMP: The Plain and Simple Way, 2nd Edition, by Satya Narayan Dash
[4] The Standard for Earned Value Management, by Project Management Institute (PMI)
[5] Schedule Management Handbook, by National Aeronautics and Space Administration (NASA)
