Default Formatting
As you are probably already aware, the default formatting of the Gantt Chart pane, which is shown on the right side of the Gantt Chart view, is as follows:
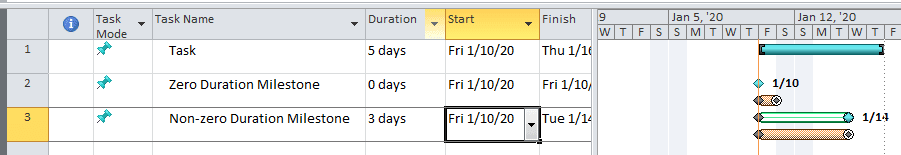
- Detailed tasks are displayed with a light blue Gantt bar with the names of the assigned resources shown at the right end of the Gantt bar.
- Milestone tasks are displayed as a black diamond with the Finish date of the task shown to the right of the milestone symbol.
- Summary tasks are displayed as displayed as a black square bracket, with no text to the right of the summary task symbol.
- Link lines are displayed with a “right angle” arrow from one end of the Predecessor task’s Gantt bar to one end of the Successor task’s Gantt bar. For example, when the dependency is Finish-to-Start, the link line is displayed from the Finish end of the Predecessor task’s Gantt bar to the Start end of the Successor task’s Gantt bar.
You can see the default formatting of the Gantt Chart pane in Figure 1.
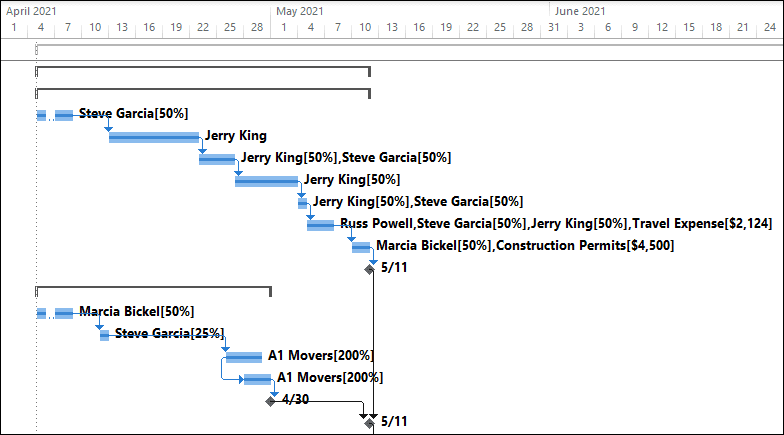
Figure 1: Default Formatting of the Gantt Chart view
Formatting the Gantt Chart Pane
Microsoft Project offers you many ways to apply custom formatting to the Gantt Chart pane portion of the Gantt Chart view. For example, suppose that we want to format the Gantt Chart pane with the following requirements:
- Display summary tasks as a green square bracket with the % Complete value shown to the right of the summary task symbol.
- Display detailed tasks with a light green color, with the initials of the assigned resources shown above the Gantt bar, and the % Complete value shown to the right of the Gantt bar.
- Display milestone symbols as a red diamond, with the Finish date shown to the left of the milestone symbol, and the % Complete value shown to the right of the milestone symbol.
- Display link lines using a curved arrow rather than the “right angle” arrow.
To make the above formatting changes, we will need to take advantage of the power of the Bar Styles dialog, along with using an option that is available in the Layout dialog. The fastest way to access the Bar Styles dialog is to double-click anywhere in the white part of the Gantt Chart pane. You can also access the Bar Styles dialog by displaying the Format ribbon, clicking the Format pick list button in the Bar Styles section of the ribbon, and then selecting the Bar Styles item on the pick list. Using either method, Microsoft Project displays the default Bar Styles dialog shown in Figure 2.
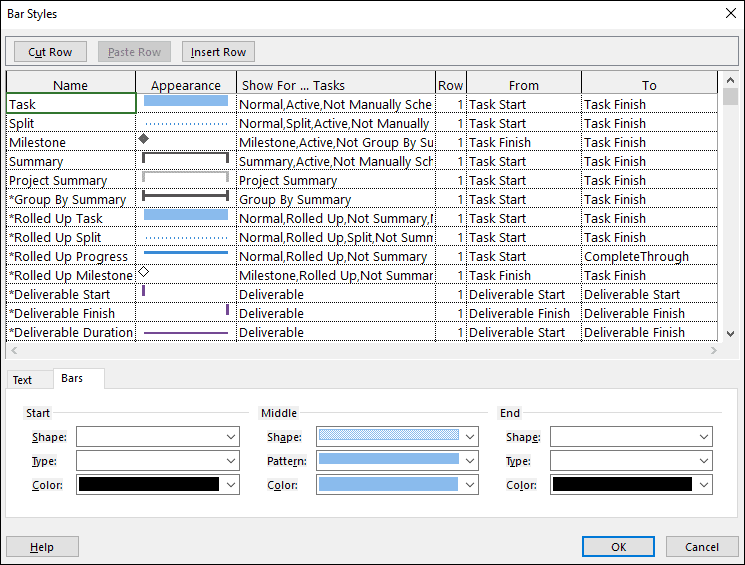
Figure 2: Bar Styles dialog
The Bar Styles dialog displays a data grid that includes every symbol currently available in the applied view. For example, notice that the list includes items such as the Task, Split, Milestone, and Summary symbols. To the right of each symbol, the data grid includes columns with the instructions for how Microsoft Project will draw the symbol. For example, notice that the Task symbol is drawn from the Task Start date to the Task Finish date, as shown in the From and To columns for the Task item in the data grid.
At the bottom of the data grid, the Bar Styles dialog includes two additional formatting sections, and each section is displayed with its own worksheet tab. When you click the Bars tab, the Bars section includes the formatting instructions for the start, middle, and end portions of the symbol, including the color used for each portion. When you click the Text tab, the Text section shows what text to display at the left and right ends of the symbol, as well as on the top, bottom, and inside of the symbol.
Formatting Summary Tasks
To format the summary tasks according to our requirements, I will need to complete the following steps:
-
- Display the Bar Styles
- Select the Summary item in the data grid.
- In the Bars section of the dialog, change the Color value to Green for the Start, Middle, and End portions of the symbol, such as shown in Figure 3.

Figure 3: Change the color of summary task Gantt bars
- Click the Text worksheet tab.
- In the Text section of the dialog, click the Right pick list and select the % Complete field, such as shown in Figure 4.
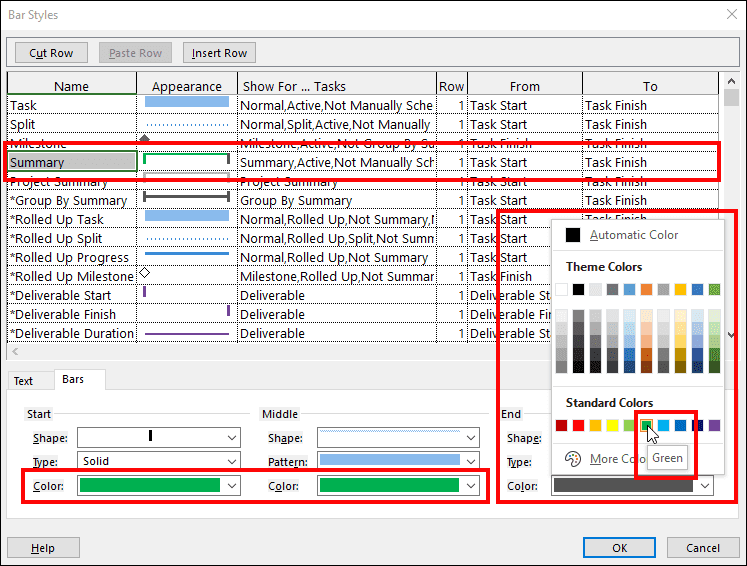

Figure 4: Change the text displayed for summary task Gantt bars
Formatting Detailed Tasks
To format the detailed tasks according to our requirements, I will need to complete the following steps:
-
- Select the Task item in the data grid.
- In the Bars section of the dialog, change the Color value to Green, Lighter 60% for only the Middle portion of the symbol, such as shown in Figure 5.
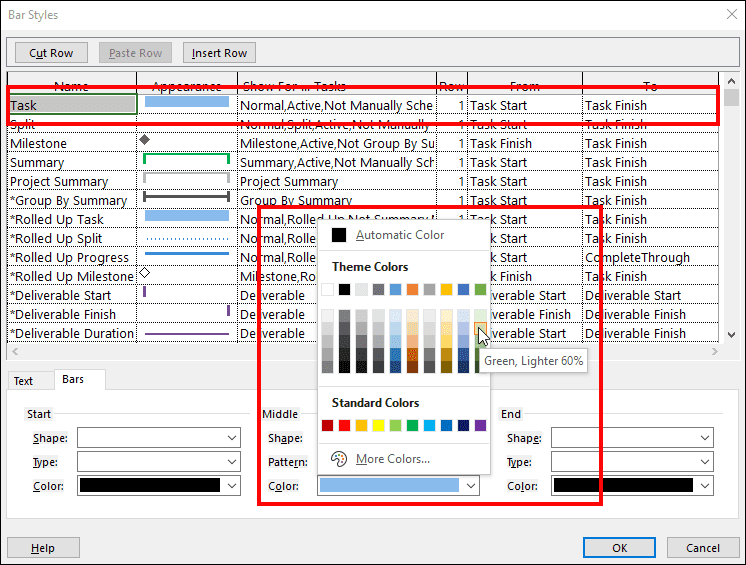
Figure 5: Change the color of detailed task Gantt bars
-
- Click the Text worksheet tab.
- In the Text section of the dialog, click the Right pick list and select the % Complete item, then click the Top pick list and select the Resource Initials item, such as shown in Figure 6.
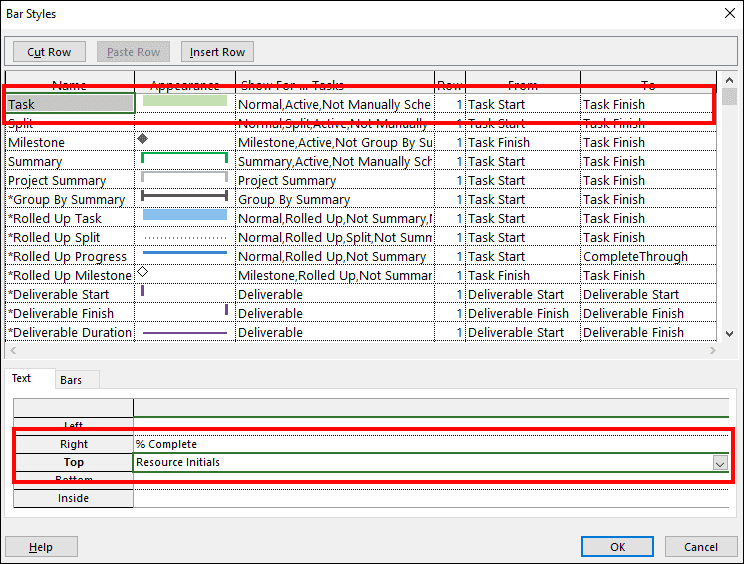
Figure 6: Change the text displayed for detailed task Gantt bars
Formatting Milestone Tasks
To format the milestone tasks according to our requirements, I will need to complete the following steps:
-
-
- Select the Milestone item in the data grid.
- In the Bars section of the dialog, change the Color value to Red for only the Start portion of the symbol, such as shown in Figure 7.
-

Figure 7: Change the color of milestone task Gantt bars
-
-
- Click the Text worksheet tab.
- In the Text section of the dialog, click the Left pick list and select the Finish item, then click the Right pick list and select the % Complete item, such as shown in Figure 8.
-
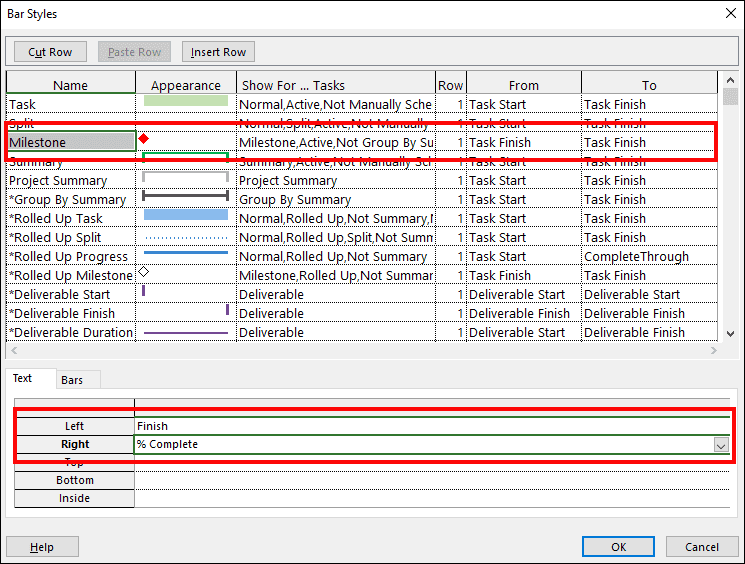
Figure 8: Change the text displayed for milestone task Gantt bars
-
-
- Click the OK button to close the Bar Styles dialog and apply the new formatting to summary tasks, detailed tasks, and milestone tasks.
-
Formatting Link Lines
After applying the custom formatting to summary tasks, detailed tasks, and milestone tasks, I am ready to format the link lines by completing the following steps:
-
-
- Click the Format tab to display the Format
- In the Format section of the Format ribbon, click the Layout Microsoft Project displays the Layout dialog shown in Figure 9.
-
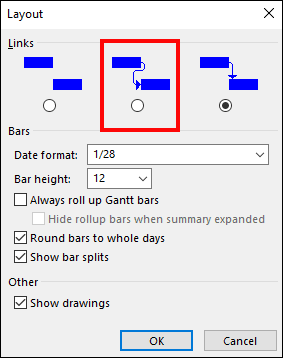
Figure 9: Layout dialog
-
-
- In the Layout dialog, select the second item in the Links section, as indicated in Figure 9 shown previously.
- Click the OK button when finished.
-
Figure 10 shows the Gantt Chart pane portion of the Gantt Chart view with all of the custom formatting applied.
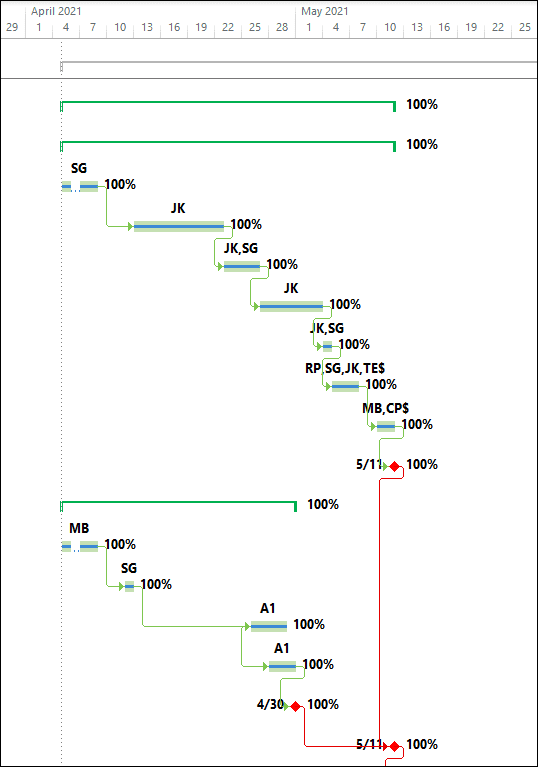
Figure 10: Formatted Gantt Chart pane
Extra for Experts
To learn more about how the Bar Styles dialog controls the formatting of any Gantt-based view, apply a view such as the Tracking Gantt view, and then study each of the items shown in the data grid at the top of the Bar Styles dialog. For example, for the Tracking Gantt view, notice that Microsoft Project displays items like Critical, Critical Split, and Critical Progress at the top of the data grid. When you select the Critical item, notice that the Shape value is the “top half” Gantt bar. Select each of the items in the dialog and study the setup of the item, as shown on the Bars section of the dialog. You can use information like this to create your own custom formatting of Gantt bars in any Gantt-based view.